Horus
Blind-area Detection and Communication based on Reconfigurable Intelligent Surface
I. Introduction
According to
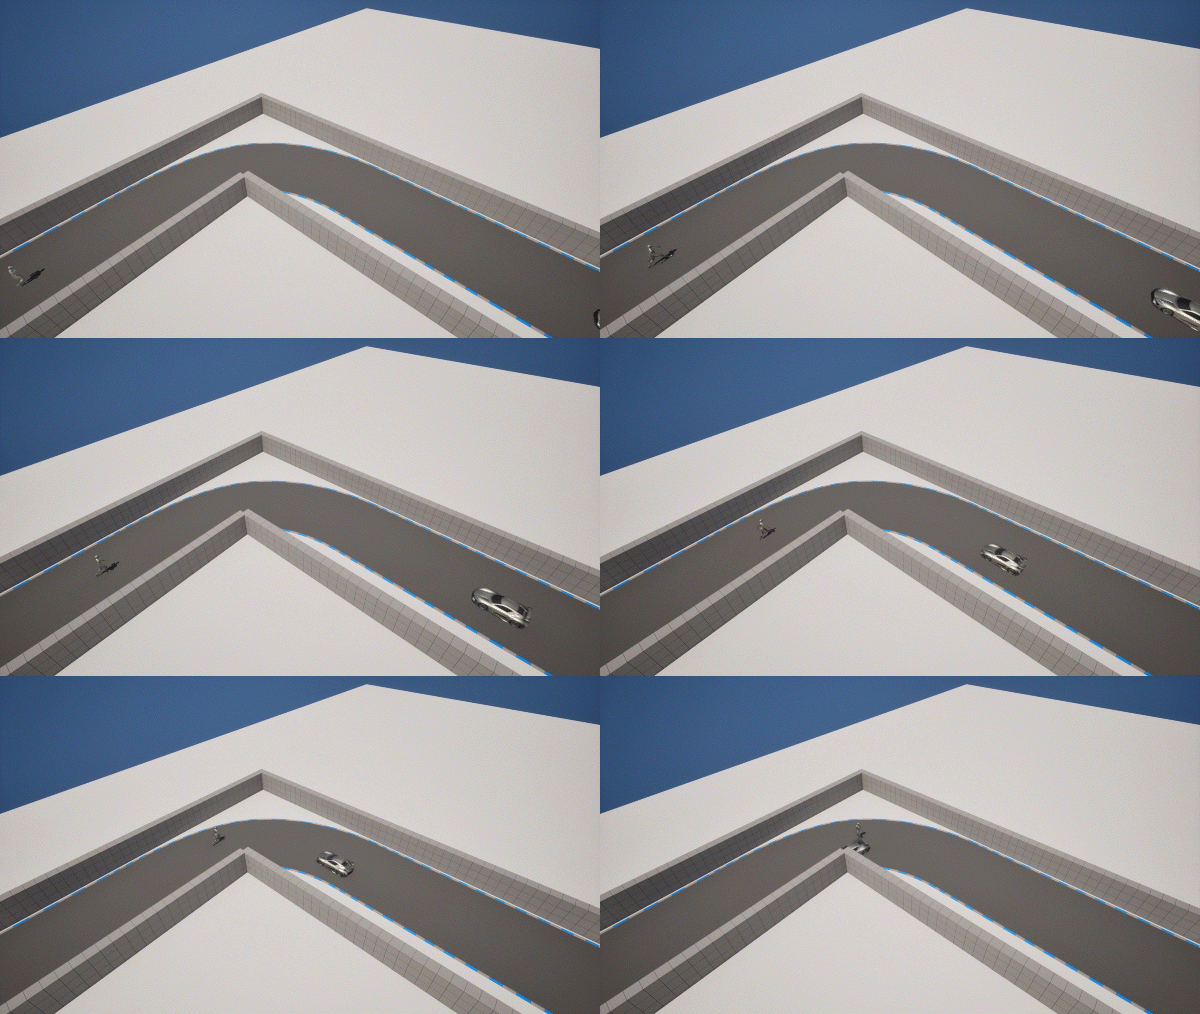
To tackle the above issue, we propose Horus
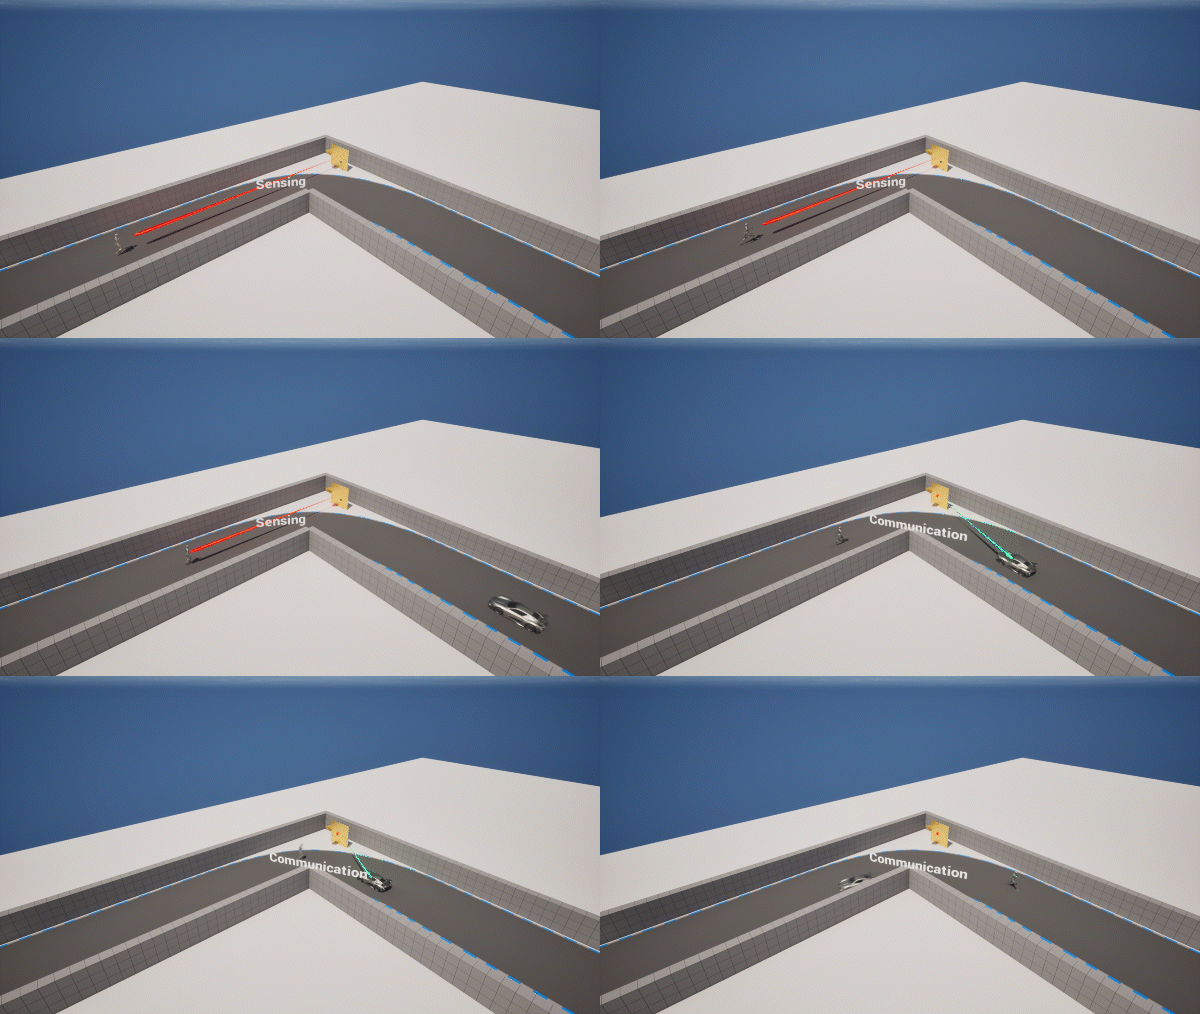
II. Methodology
1. Frequency Shift Keying Radar
Radar systems are traditionally associated with the transmission and reception of radio frequency (RF) signals for detecting and tracking objects. FSK, in the context of radar, involves changing the frequency of the transmitted signal to convey information, which is often carried by the phase of signals.
Let’s start from the simplest problem, if the baseband frequency is $f_{c1}$, then the transmitted signal can be expressed by, \begin{equation} S_{tx}=A_{tx}e^{j(2\pi f_{c1}t+\phi_1)}, \end{equation} where $A_{tx}$ represents the gain of the transmit antenna, and $\phi_1$ denotes the initial phase shifts introduced by the phase-lock-loop.
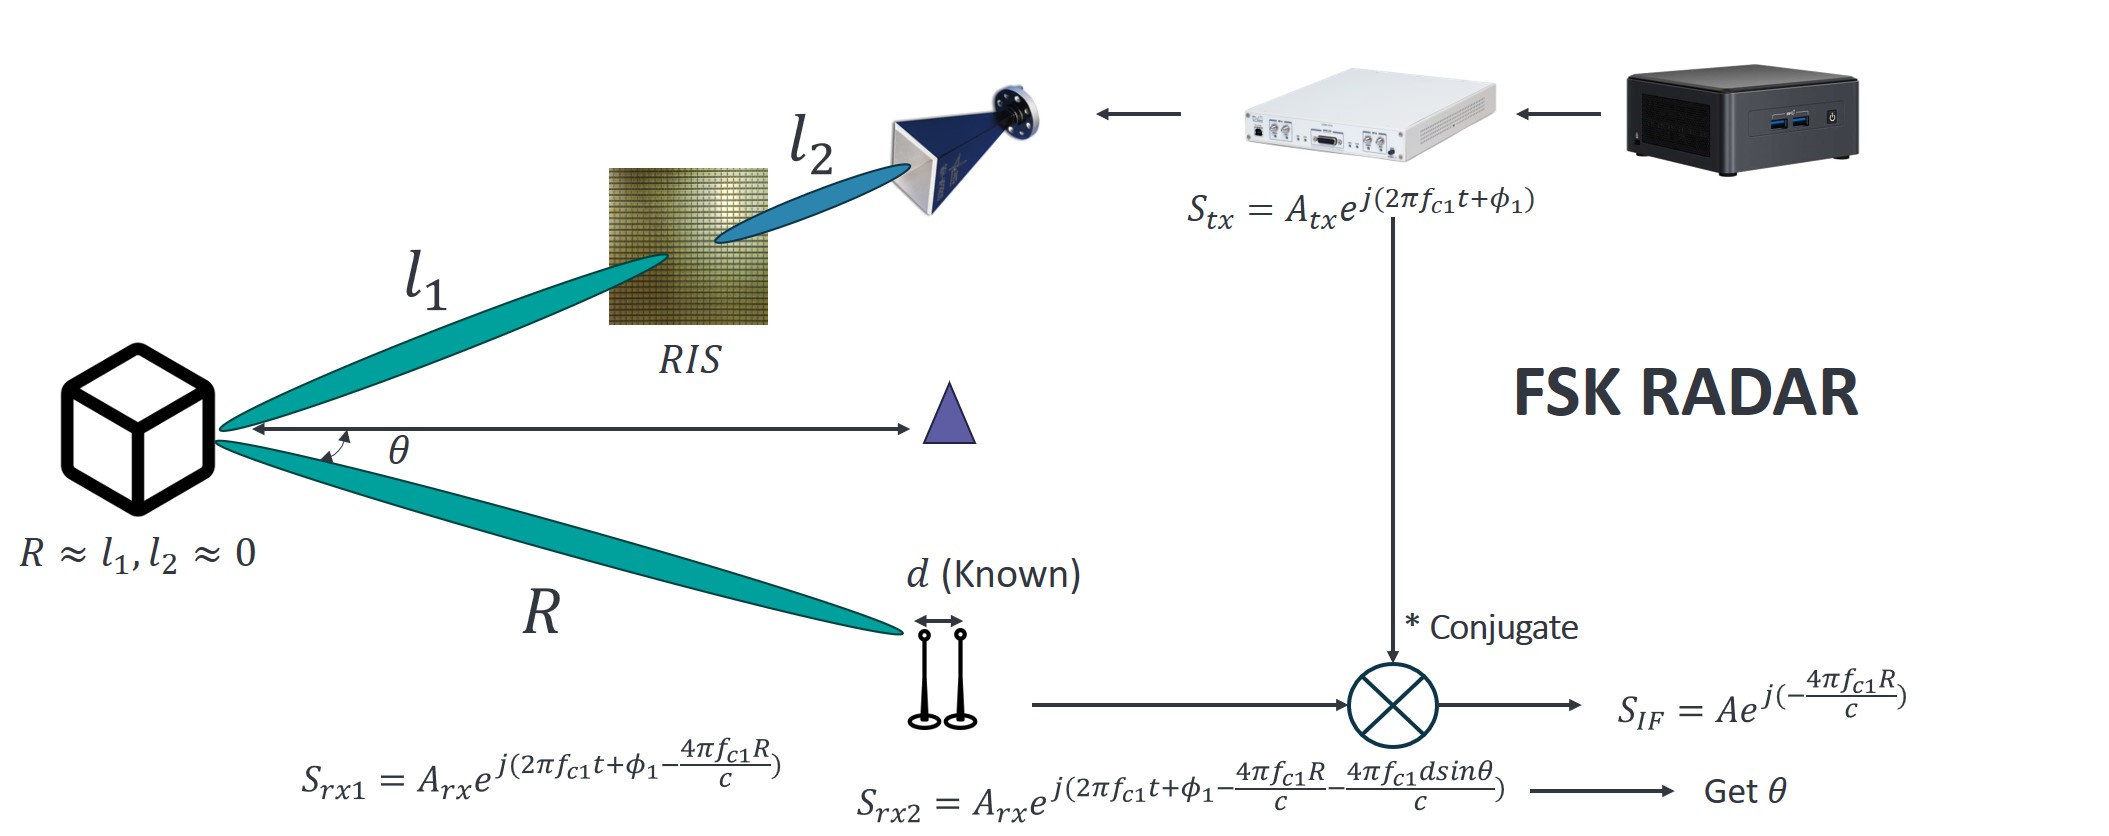
The distance between the transmit antenna and RIS can be omitted compared to the range of the object. Thus, the distance of flight can be directly expressed by $2R$. To measure the angle of the detected object, we can place two receive antennas with a very small interval $d$, and the received signals can be expressed by \begin{equation} S_{rx1}=A_{rx1}e^{j(2\pi f_{c1}t+\phi_1-\frac{4\pi f_{c1}R}{c})} \end{equation} and \begin{equation} S_{rx2}=A_{rx2}e^{j(2\pi f_{c1}t+\phi_1-\frac{4\pi f_{c1}(R+dsin\theta)}{c})}, \end{equation} in which $A_{rx1}, A_{rx2}$ represents the gain of two paths considering both the antenna gain and propagation loss. Here $\theta$ represents the azimuth angle of the object relevant to the antenna, and by the operation of multiplying conjugate, one can determine the value of it. Take the received signal $S_{rx1}$ and multiply it with the conjugate of the transmit signal, we have \begin{equation} S_{IF}=A_{rx1}A_{tx}e^{-j\frac{4\pi f_{c1}R}{c}}=Ae^{j\psi_1}, \psi_1=-\frac{4\pi f_{c1}R}{c}. \end{equation}
One may say that with the phase information of a single-frequency wave, we can already know the range of the object. However, it is impossible in practice as it is a continuous wave and we can not locate where to start measurement. Besides, to get higher accuracy of ranging, we often choose to use frequency up to GHz, in that case, the maximum range of $\frac{c}{2f_{c1}}$ is too small to satisfy basic requirements.
To tackle this issue, we introduce another transmit signal with a different frequency $f_{c2}$, and follow the same procedure to get the phase information $\psi_2$, then combining the two received signals we have
\begin{equation} R=\frac{c(\psi_2-\psi_1)}{4\pi(f_{c1}-f_{c_2})}. \end{equation}
As for the velocity, as we use two continuous waves in FSK, one can easily adopt the Doppler effect to estimate the velocity. If we assume the transmitted frequency is $f_0$, then the relation between the Doppler frequency and velocity $v$ of the target can be expressed by
\begin{equation} f_D = \frac{2f_0v}{c}. \end{equation}
Some may ask if the target is moving, the Doppler effect will disturb the range we get from the above equations. In fact, if you insert the Doppler frequency into these functions, you will get a time-related term of $\frac{2(f_{c1}-f_{c_2})v}{c}t$, which does not affect the measurement of the phase.
FSK radar can exhibit resilience to certain types of interference due to its inherent modulation scheme
Though FSK radar has many advantages concerning the aspect of radar, we choose this method mainly for another important reason, which will be discussed in the fourth section.
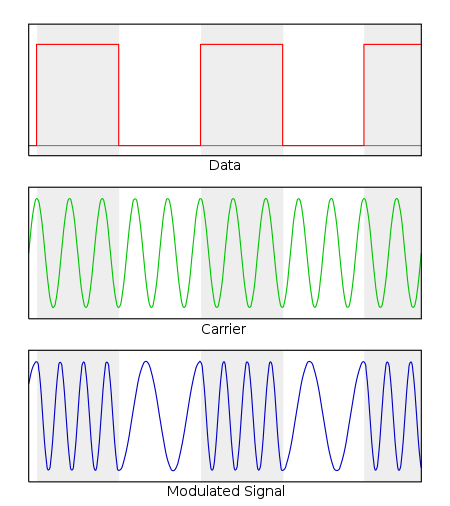
2. Frequency Shift Keying Modulation
In the last subsection, the information carried by the phase of FSK signals is well-discussed, which can be used to determine the range/angle of the object. However, apart from the phase, the amplitude of FSK signals also carries information. In traditional FSK modulation and demodulation
3. Reconfigurable Intelligent Surface
As a cutting-edge physical-layer technology for wireless communication, the reconfigurable intelligent surface (RIS) has the potential to further enlarge the capacity of communication systems meanwhile providing larger and more accurate sensing. It consists of numerous passive reflecting units, which can be metamaterial-based units or antennas. These units can be electronically controlled by external voltage or current, thus, it has the ability to change the amplitude and phase shifts of incident signals to create more directional beams. RIS is considered energy-efficient because it operates with passive reflecting units that do not require continuous power. This can contribute to the overall energy efficiency of wireless communication systems.
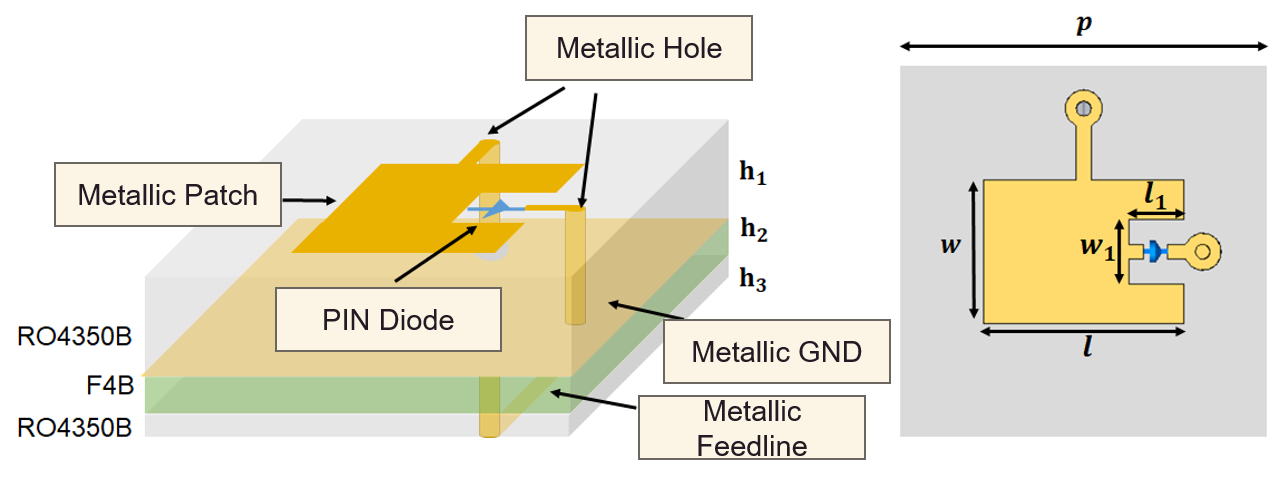
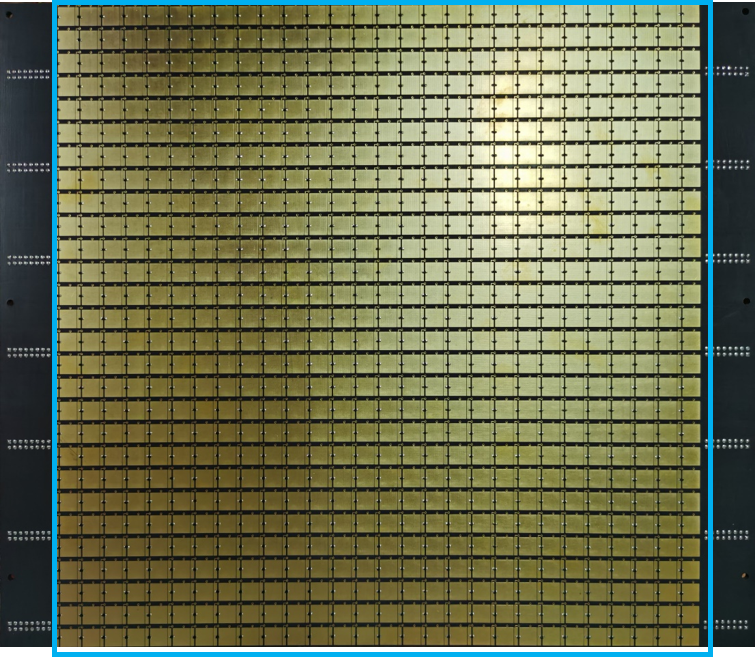
The unit design of RIS is shown on the left in the above figure. It has a typical structure of a three-layer metallic structure. The top layer is a metallic patch consisting of a PIN diode, which is placed on a rectangular area hollowed out from the patch. This design can increase the degree of freedom in designing the unit. The two parts of the metallic patch connected to the edges of the diode are connected to the bottom layer through vias. The middle layer is the metallic ground made of a monoblock of copper plate, which provides grounding while isolating the interference of the supply network on electromagnetic waves. The bottom layer is the metallic feedline connected to the control circuit. Through it, different bias voltages are applied to the diode to change the state of the unit. Between the metal layers, there are two layers of dielectric material (RO4350B) and one layer of bonding film (F4B), serving as the substrate for the metal layers (RO4350B and F4B are two special materials for high-frequency RF circuit design, click the link for more information).
The size of each unit is $5\times 5$ mm, which means the space periodic distance $p=5mm$. It is less than half the wavelength of a 26 GHz EM wave, thus, we can realize a narrower beam with the surface. The rectangular patch structure parameters and the characteristics of the diode circuit within the topmost metal layer are the primary influencing factors on the unit surface impedance. These factors directly impact the amplitude and phase of the EM wave reflected from the unit. The whole structure can be considered as a dual-port network, by controlling the on-off state of the PIN diode, we are able to change the equivalent circuit of this network and its response to make the phase shift between two states as $\pi$.
III. RIS-Antenna System Design
The foundation of Horus is the RIS-Antenna system, which has a powerful beamforming scheme with mmWave, meanwhile providing a cost-efficient solution compared to the phased-array antenna. To realize the ability of beam scanning required by Horus, the RIS-Antenna system should be designed to satisfy the following requirements:
| Requirements | Parameters |
|---|---|
| Operating Frequency | 25-27 GHz |
| Surface Size | $16 cm\times 16 cm$ |
| Number of Units | $32 \times 32$ |
| Gain | $> 22 dBi$ |
| Azimuth maximum angle of beam scan | $\pm 60^{\circ}$ |
| Elevation maximum angle of beam scan | $\pm 10^{\circ}$ |
| Polarization Mode | Linear |
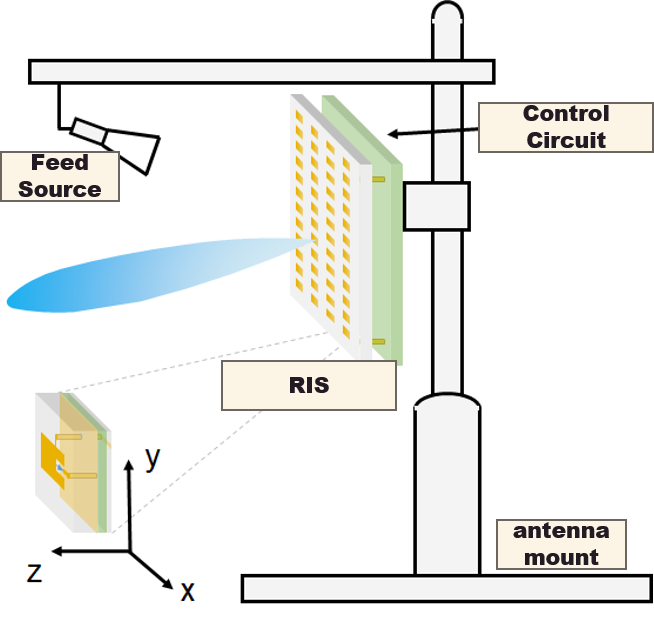
The work process of the RIS-Antenna system can be elaborated as follows. The horn feed source located above RIS is connected to the high-frequency circuit. It transmits incident EM waves containing the signal to be transmitted to the metasurface. Each unit on the array reflects the incident waves and applies corresponding amplitude and phase changes. According to the phase modulation theory of EM wavefronts, the states of different units corresponding to different directional beams are calculated. The control circuit communicates with a host computer that alters its output, thereby applying different bias voltages to each unit to configure RIS. The reflected waves from each unit can then be superimposed in a given direction, achieving beamforming functionality.
1. Phase Distribution of RIS
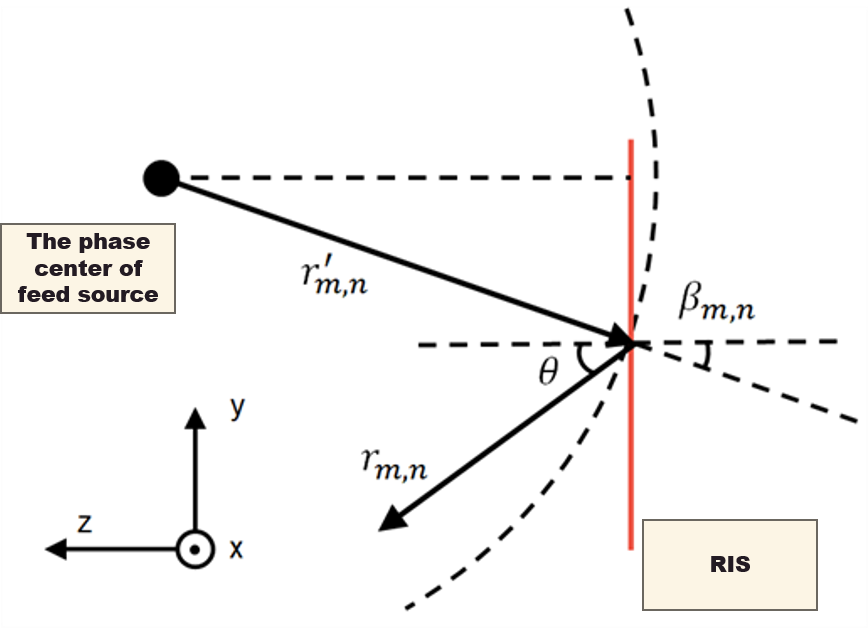
As shown in the above figure, RIS is on the x-y plane, which is centered by $(0, y_f, z_f)$. The horn antenna can be considered as a point source, and it emits EM waves on RIS in the form of spherical waves
Let $\theta$ represent the elevation angle in a spherical coordinate system with the center of RIS as the sphere’s center, which is the angle between the projection of the vector on the x-z plane and the z-axis. Let $\phi$ represent the azimuthal angle in the spherical coordinate system, which is the angle between the vector in the y-z plane and the x-axis. In this case, the electric field strength of the unit in the far-field direction $(\theta, \phi)$ is given by \begin{equation} E_{m,n}(\theta, \phi) = E_{m,n}^{in} \sqrt{|\tau_{m,n}|^2 \frac{1}{2\pi(r_{m,n})^2}} \exp\left(-jk_0 r_{m,n}\right) \exp\left(j \arg(\tau_{m,n})\right) \end{equation} Where $\tau_{m,n}$ represents the reflection coefficient of the unit. To maximize the radiation intensity of the metasurface in a given beam direction, ideally, the reflection phase of each unit is given by \begin{equation} \arg(\tau_{m,n}) = k_0 r_{m,n}^{\prime} - k_0 r_{m,n} \end{equation} Due to the discrete nature of the unit states, it is not always possible to achieve the maximum radiation intensity. The selection of unit states is aimed at making the reflection phase as close as possible to the ideal reflection phase.
2. Design of the Macrocell
In practical application, when the size of RIS is too large, it is often hard to design the control circuit to configure all the units with a very high speed. Intuitively, the units that are adjacent to each other shows very similar configuration. Thus, we can combine these units into a Macrocell to configure them with the same signal from the control circuit.
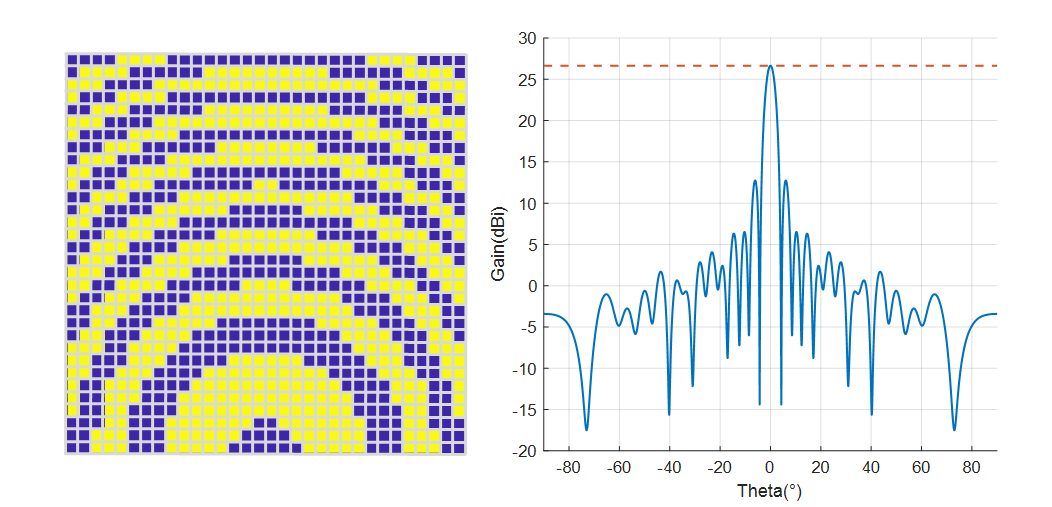
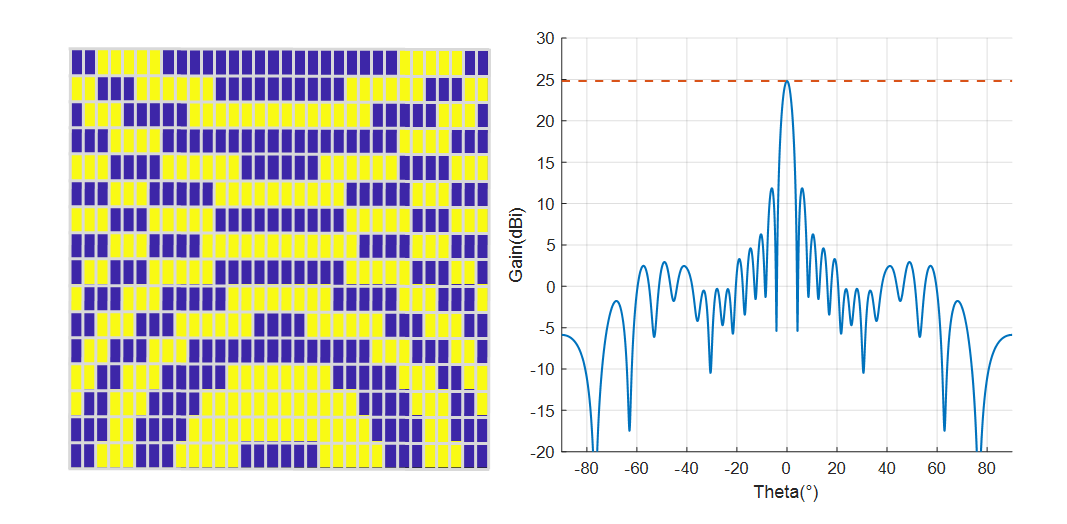
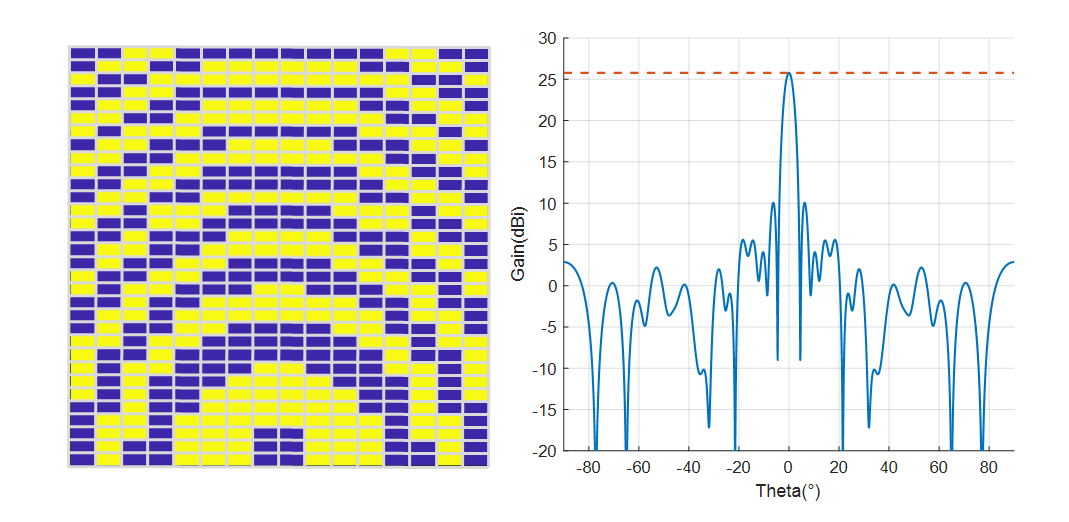
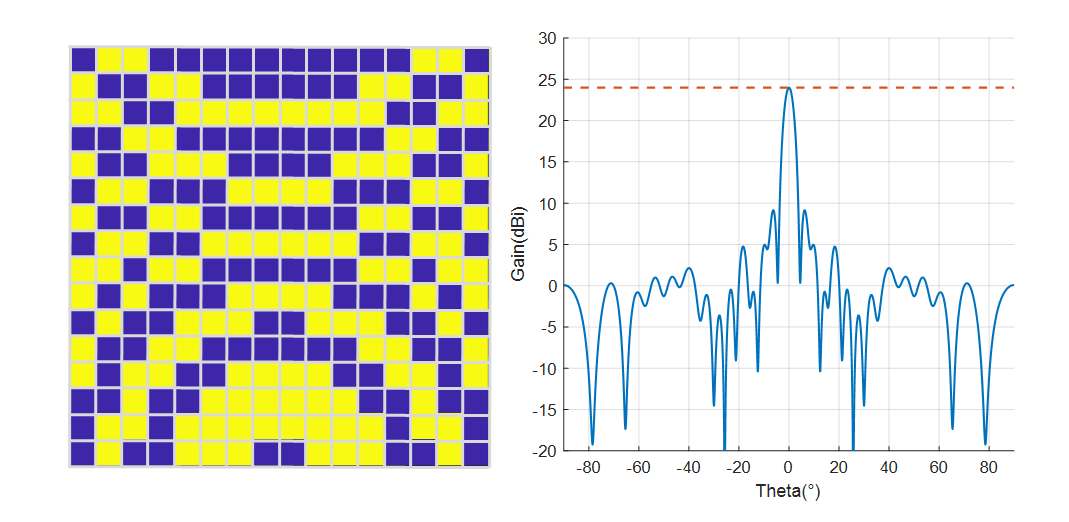
In the above figures, the blue and yellow colors of each unit indicate its state of “0” and “1” respectively. For all the units in the same macrocell, they have the same state. The simulation result shows that when the macrocell size is $1\times 1$, the system has the highest gain of 26.65 dBi, while when it is $2\times 2$, the gain degrades to 23.99 dBi. The gains of sizes $1\times 2$ and $2\times 1$ are 24.81 dBi and 25.77 dBi. The reason is that in order to avoid the feed source obstructing the EM wave, it is placed on the y-z plane and away from the z-axis. Thus, the incident wave has a wider range of phase shifts along the y-axis. Compared to the other, $2\times 1$ macrocell can provide a larger resolution along the y-axis and a smaller error of phase compensation. Therefore, its gain is higher.
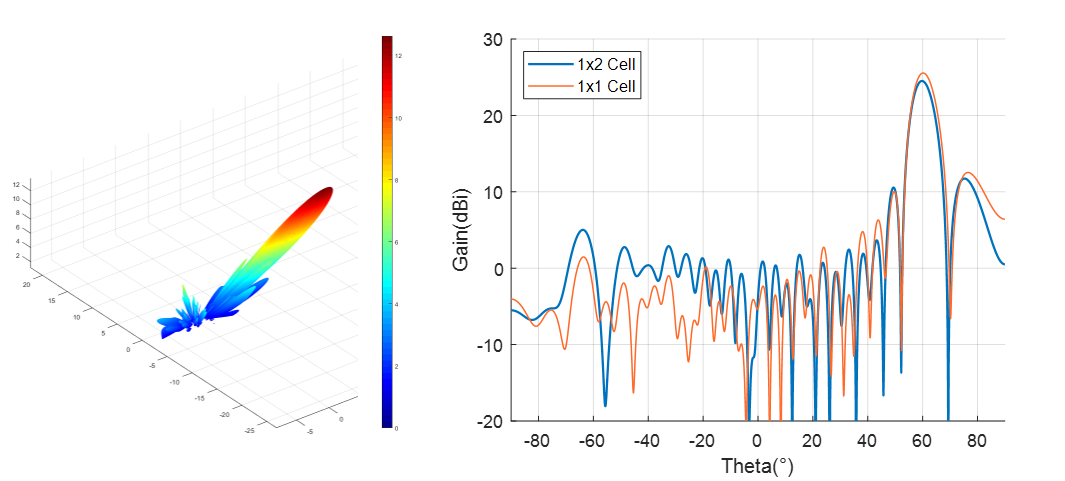
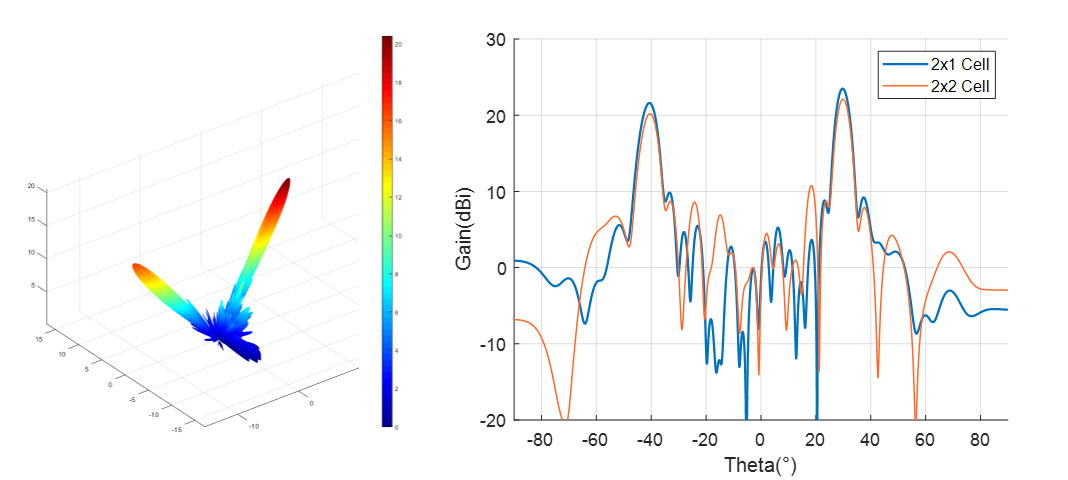
As shown in the above figure, when the macrocell size is $1\times 1$ and $1\times 2$, the azimuth scanning range can be up to $60^\circ$ meanwhile providing a gain of 24.51dBi. On the contrary, when the size comes to $2\times 1$ and $2\times 2$, the antenna exhibits noticeable side lobes at a beam scanning angle of $30^\circ$. For a reflective array antenna, as the beam pointing angle increases, the main lobe gain decreases. However, because the side lobes, the gain of $2\times 1$ macrocell at $30^\circ$ is even lower than $1\times 2$ macrocell at $60^\circ$. The occurrence of side lobes is attributed to the correlation between the unit’s horizontal scanning angle and the phase modulation accuracy in the x-axis. Due to the adoption of a macrocell design, the increase in phase compensation error in the x-axis for the $2\times 1$ macrocell results in decreased gain and the generation of side lobes. In our design for Horus, we aim for an antenna system that has a larger range of azimuth angle scanning. Thus, considering both antenna gain and beam scanning range comprehensively, we choose to use the macrocell size of $1\times 2$.
3. Position of the Feed Source
The position of the feed source has very little impact on the scanning angle while mostly affecting the gain, so we compare different main lobe gains of the system when $\theta=0^\circ$.
To avoid the feed source obstructing the reflected wave from RIS, we placed it at the same height as the upper edge of RIS, meanwhile changing its horizontal locations. In the whole process, we keep the feed source pointing to the center of RIS.
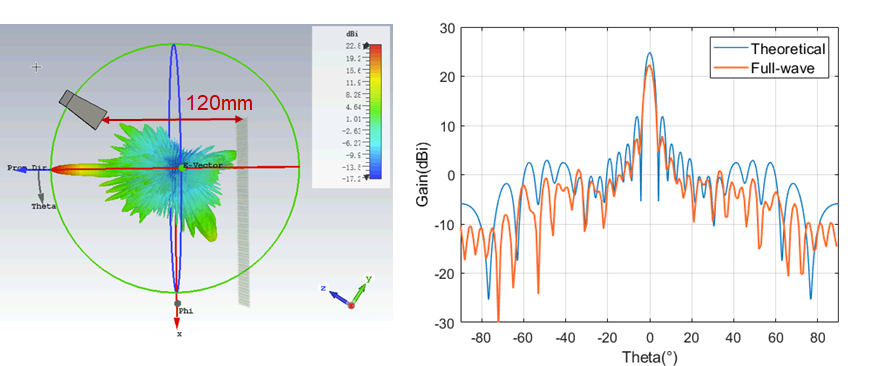
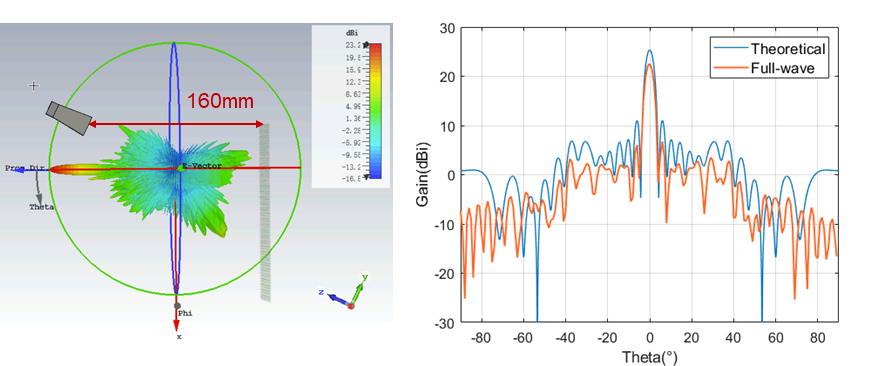
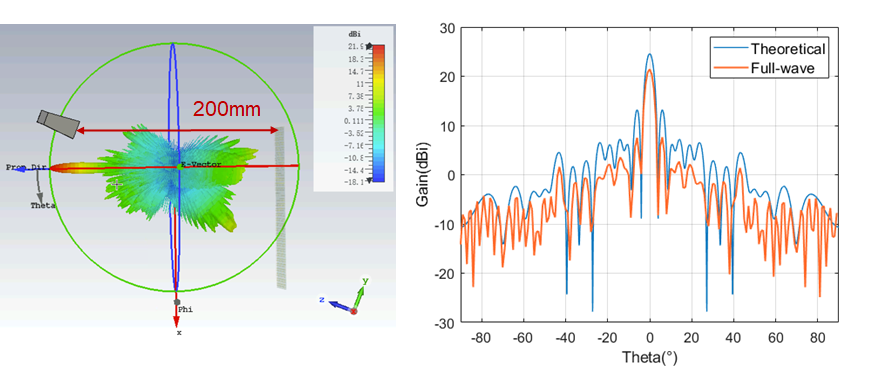
Theoretical analysis and full-wave simulation yield antenna far-field radiation patterns that closely match under different feed source positions. When the feed source is at a distance of 160 mm along the array axis, the maximum gain of the main lobe is achieved, with a simulated result of 25.35 dBi. At a distance of 120 mm, the main lobe gain decreases to 25.02 dBi. When the feed source is at a distance of 200 mm, the main lobe gain reaches its minimum, with a simulated result of 24.56 dBi.
| Positions of the Feed Source | Theoretical Gain | Full-wave Gain | Theoretical Beam Width | Full-wave Beam Width |
|---|---|---|---|---|
| (0,80mm,120mm) | 25.02 | 22.31 | 3.7 | 3.8 |
| (0,80mm,160mm) | 25.35 | 22.58 | 3.7 | 3.7 |
| (0,80mm,200mm) | 24.56 | 21.4 | 3.7 | 3.6 |
Thus, we choose to fix the position of the feed source to (0,80mm,160mm).
4. Performance
(1) Gain
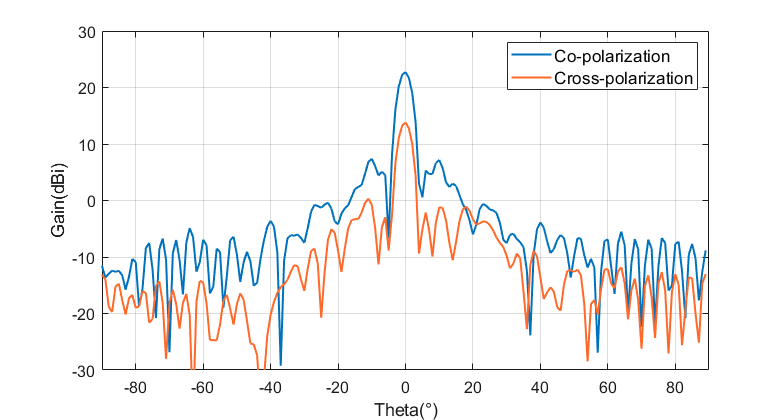
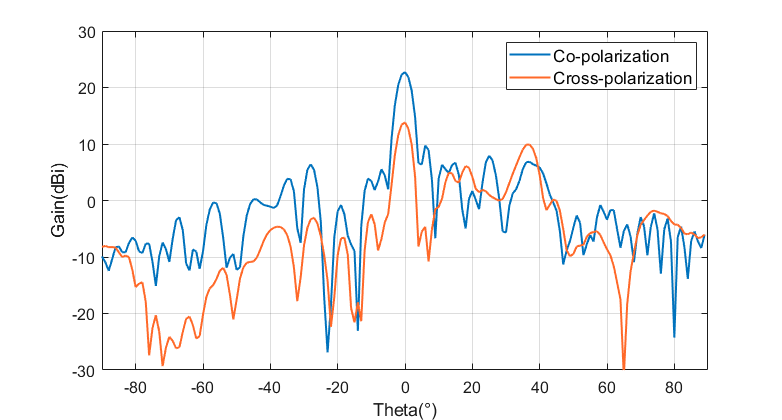
Firstly, we analyze the gain of the RIS-Antenna system. The above figures show the optimized far-field radiation patterns of the antenna system in the E-plane and H-plane when the beam is directed horizontally at $\theta=0^\circ$. At this point, the antenna’s main polarization direction aligns with the feed source’s polarization direction, parallel to the x-axis. The main polarization gain is 22.73 dBi, and the gain for the orthogonal electric field component at $\theta=0^\circ$, i.e., the cross-polarization component, is 12.81 dBi.
The E-plane of the antenna corresponds to the plane formed by the electric field direction and the maximum propagation direction of the electromagnetic wave, which is the x-z plane. Its radiation pattern is shown on the left, with a main lobe beamwidth of 3.8 degrees. It is observed that the E-plane pattern is symmetrical about $\theta=0^\circ$, and this symmetry is due to the feed source’s position being in the y-z plane, and the metasurface being symmetrical about the y-z plane. The compensatory phase required for units on both sides is the same, resulting in a symmetrical diode operating state.
The H-plane of the antenna corresponds to the plane formed by the magnetic field direction and the maximum propagation direction, which is the y-z plane. Its radiation pattern is shown on the right, with a main lobe beamwidth of 4.1 degrees.
(2) Bandwidth
Secondly, we give an analysis of the bandwidth of the RIS-Antenna system. We choose three center frequencies of 25.4 GHz, 26 GHz and 26.6 GHz, configuring RIS to direct the beam at $\theta=0^\circ$ and testing the gain flatness with an incident wave that has 800 MHz bandwidth.
| Center Freq. 25.4GHz | Center Freq. 26GHz | Center Freq. 26.4GHz | |||
|---|---|---|---|---|---|
| Freq. (GHz) | Gain(dBi) | Freq. (GHz) | Gain(dBi) | Freq. (GHz) | Gain(dBi) |
| 25.0 | 22.34 | 25.6 | 22.23 | 26.2 | 21.84 |
| 25.2 | 22.32 | 25.8 | 22.35 | 26.4 | 22.04 |
| 25.4 | 22.40 | 26.0 | 22.73 | 26.6 | 21.99 |
| 25.6 | 22.31 | 26.2 | 22.74 | 26.8 | 21.78 |
| 25.8 | 22.35 | 26.4 | 22.60 | 27.0 | 21.56 |
Overall, the gain variation within each center frequency bandwidth is less than 1dB, demonstrating excellent gain flatness. It is observed that the antenna achieves its maximum gain at the center frequency of 26GHz. At 25.4GHz and 26.6GHz, there is a slight decrease in gain. The reason for this is that the designed RIS unit approaches a phase difference close to 180 degrees between the cutoff and conductive states of the diode at 26GHz. At this point, the RIS unit exhibits the best phase modulation performance. As the frequency changes, the phase difference of the unit gradually deviates from 180 degrees. When compensating for phase errors in electromagnetic wavefront modulation, this leads to an increase in phase compensation errors, resulting in a decrease in gain.
Due to the antenna’s bandwidth performance being primarily influenced by the unit bandwidth, and the designed metasurface unit achieving good reflectance amplitude and phase across the range of 25 GHz to 27 GHz, the designed antenna exhibits minimal variation in gain over its operational bandwidth. This makes it suitable for application in broadband systems.
(3) Beam Scanning Ability
Finally, an analysis of the beam scanning capability of the designed system is conducted. Beam scanning includes both horizontal and vertical directions. In the horizontal direction, it refers to the angle between the projection of the main lobe beam on the x-z plane and the z-axis. In the vertical direction, it refers to the angle between the projection of the main lobe beam on the y-z plane and the z-axis. As shown in the below figures, simulations of the antenna’s far-field radiation patterns for different beam directions indicate that the antenna can accurately achieve beam pointing within a horizontal scanning range of 60 degrees and a vertical scanning range of 10 degrees, without being affected by side lobes.
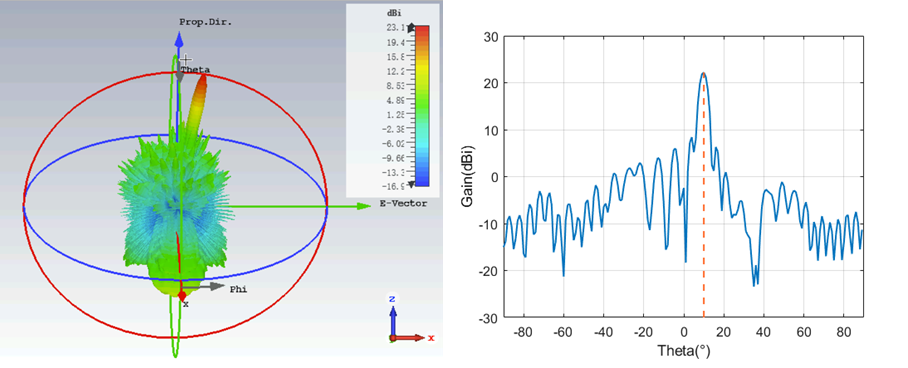
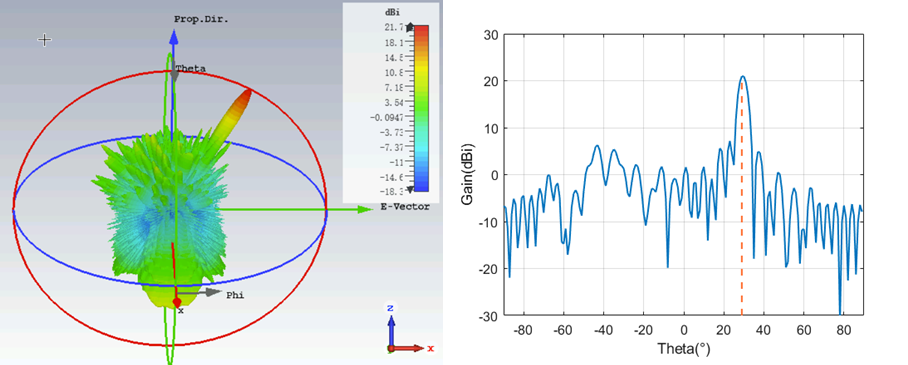
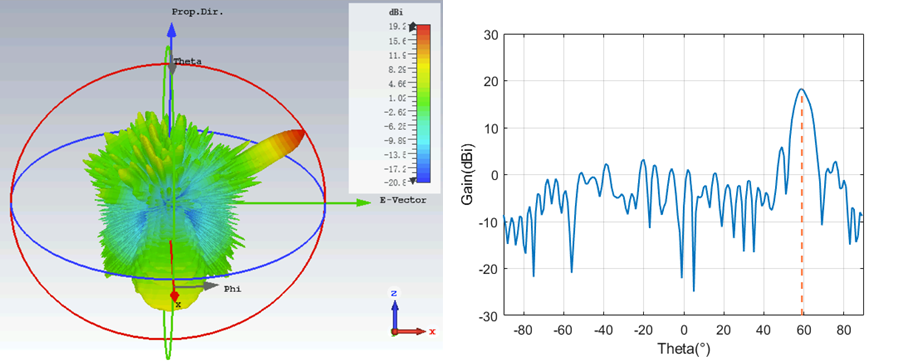
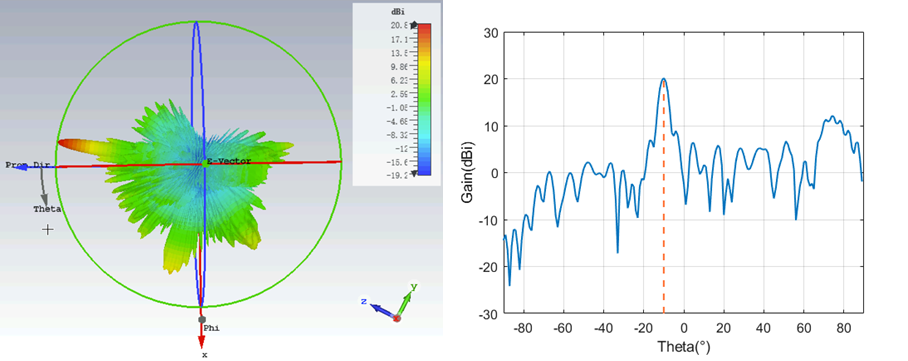
For the azimuth direction, as the scanning angle increases, the pointing error of the beam increases but remains generally less than 1.5 degrees. This allows for accurate beam pointing. The main lobe gain decreases with the angle increase, and simultaneously, the level of the first side lobe increases. Within the azimuth scanning range, the gain variation is less than 4dB. Due to the design using a $1\times 2$ macrocell, there is a larger phase compensation error in the elevation direction, resulting in lower antenna gain within the elevation scanning range. In addition, the main lobe beamwidth increases with the scanning angle, and within a scanning range of 30 degrees, the beamwidth remains less than 5 degrees. Overall, the designed RIS-Antenna can achieve a maximum scanning angle of 60 degrees in the azimuth direction and 10 degrees in the elevation direction, demonstrating good pointing accuracy and main lobe gain. This meets the requirements for subsequent system design for Horus.
| Scan angle | Actual Direction | Gain(dBi) | SLL(dB) | Beam width |
|---|---|---|---|---|
| Az 0 | -0.2 | 22.73 | -15.3 | 3.8 |
| Az 10 | 9.8 | 22.25 | -13.8 | 3.9 |
| Az 30 | 29.5 | 20.94 | -13.9 | 4.3 |
| Az 60 | 58.7 | 18.28 | -12.4 | 7.1 |
| El 10 | 10.1 | 20.18 | -8.0 | 4.2 |
5. Control Circuit Design
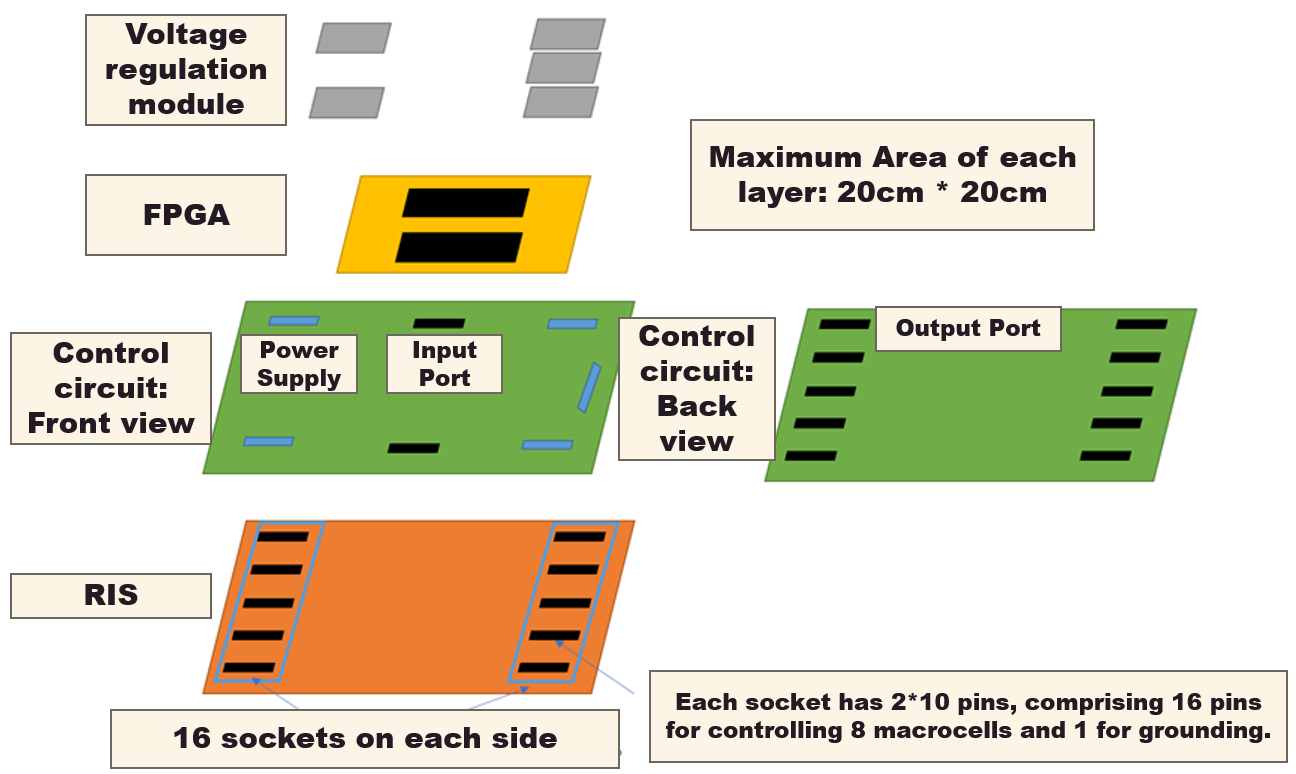
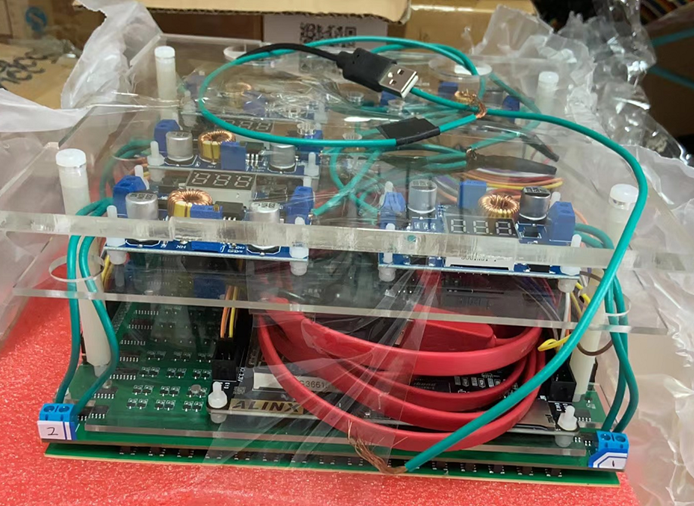
The control circuit primarily consists of a control circuit, FPGA, voltage regulation module, and acrylic bracket, in which the voltage regulation module and acrylic bracket serve to provide power to the control circuit and provide structural support, respectively. As shown in the above figure, the RIS we design consists of $32\times 32$ units, and the macrocell size is $1\times 2$, with 2 kinds of states of each macrocell. A control circuit equipped with an FPGA processes encoding sequences from the PC and converts them into voltage signals at the corresponding output ports of the control circuit. These signals are then output to the respective units in the RIS array, achieving dynamic configuration of the reflective phase of the RIS array.
(1) Control Circuit
The control circuit mainly consists of a register chip, sub-circuits, input interfaces, and output interfaces. The control circuit converts encoding signals from the FPGA into voltage signals output to the RIS units.
The circuit implements group control, where each group has multiple sub-circuits equipped with one shift register to save the number of IO ports. Considering the need for strong stability and sensitivity of register chips, shift register chips with internal TTL structure are used. This chip has one serial data input, eight parallel data outputs, one shift clock input, one latch clock input, and one power supply port. The high-level voltage of the parallel output of the register can follow the VR power supply voltage changes, providing adjustable output capability.
The sub-circuit is composed of transistors and voltage divider resistors. Due to the limited driving capability of the shift register chip caused by its energy consumption constraints, transistors are placed to introduce an external bias voltage VCC to enhance the driving capability of the register.
(2) FPGA
The design utilizes an FPGA chip (Cyclone @ EP4CE10F17C8) responsible for receiving all commands sent by the computer under the influence of a common system clock (CLK) signal. Considering the need for a balance between high transfer speed and low error rate, a CLK frequency of 1MHz is employed, and the baud rate for serial data reception is set at 9600 bits/s. The ideal switching time for the PIN diode theoretically is 10μs. The internal program of the FPGA is written in Verilog. The FPGA receives the encoded commands from the computer through a serial reception module and outputs them to the input interface of the control circuit in a serial manner. On the FPGA, this manifests as IO interface outputs corresponding high or low-level signals. Binary ‘1’ outputs a high level, while binary ‘0’ outputs a low level. Additionally, the FPGA generates the required shift clock signal and latch clock signal for the register chip of the control circuit. To mitigate high-frequency crosstalk along the line from the FPGA output IO interface to the input interface of the sub-circuit array board, a 16-fold division of the system clock is applied to produce a 62.5kHz shift clock signal for data transmission.
(3) Power Supply
To provide power to the entire control circuit, it is necessary to design a layer for a voltage regulation module. Due to the large scale of the control circuit, with multiple output ports, the current may be very large, requiring multiple voltage regulation modules to share the load. The sub-circuit array is divided into four regions, with each region powered by one voltage regulation module supplying power to the collector of transistors in the sub-circuit. Another voltage regulation module is used to power 64 register chips. The power supply VCC for the sub-circuit is 5V, and the power supply VR for the register chips is 3.3V.
IV. System Design of Horus
1. System Overview

The above figure shows the basic structure of Horus and its working scenario. A dual-board USRP that can simultaneously transmit and receive signals is connected to two horn antennas, one of which serves as the feed source in the RIS-Antenna system, while another is responsible for receiving radar echo signals. The core of Horus is the host computer, which controls both USRP and RIS. It also handles all signal processing and analysis tasks in the system.
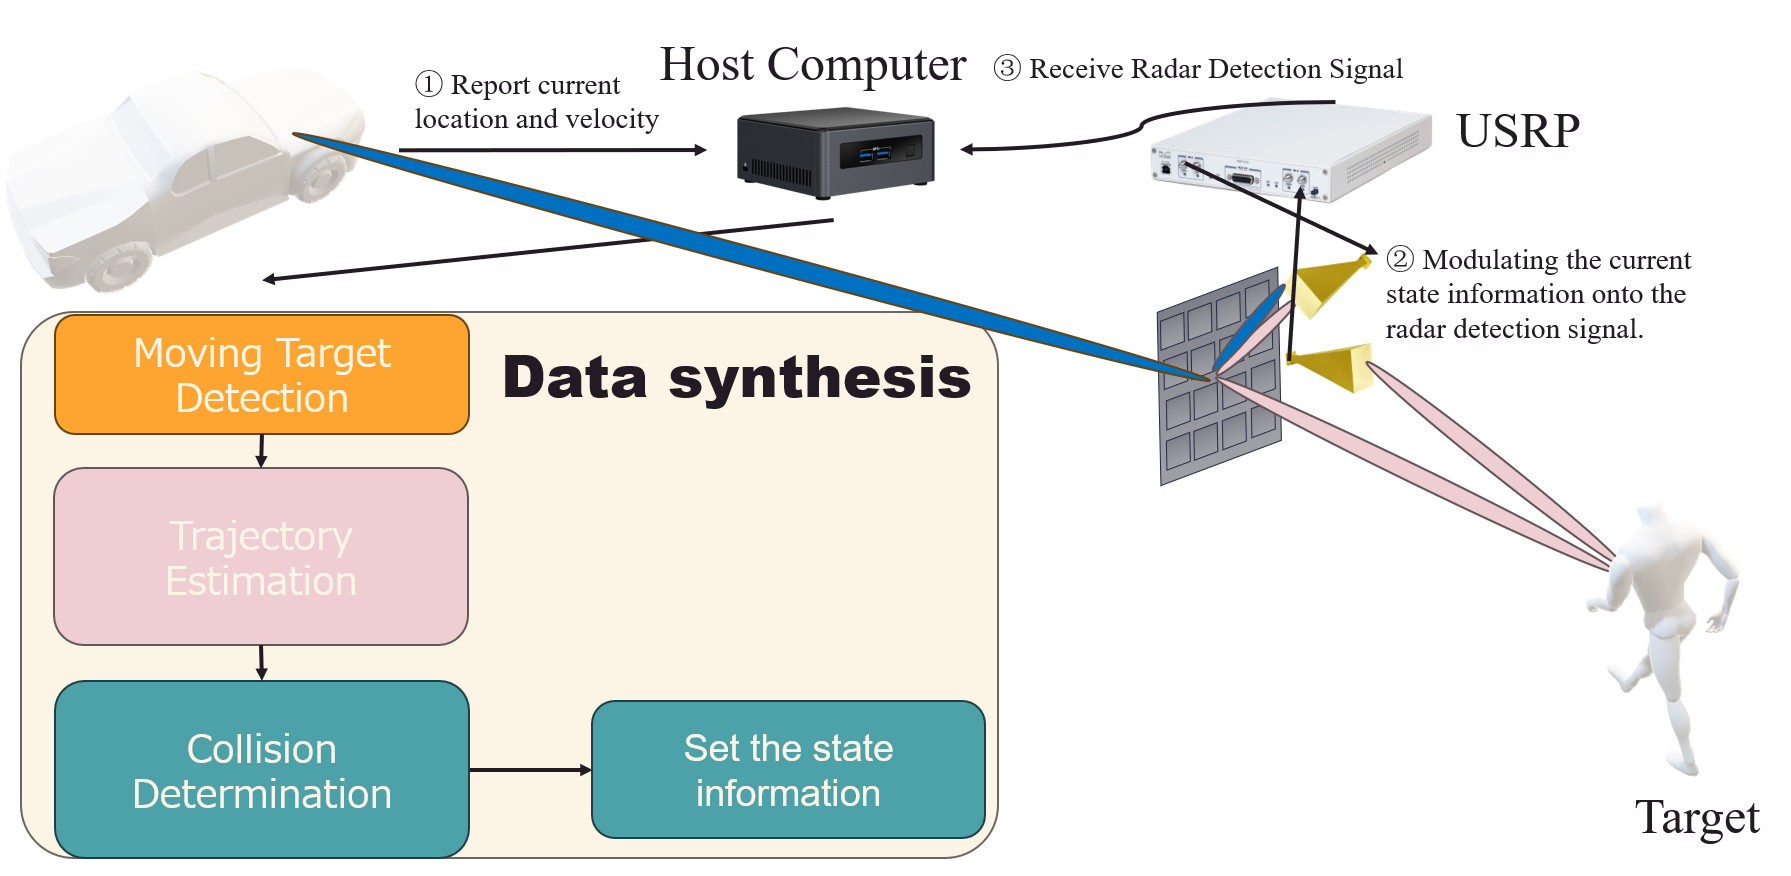
The working flowgraph shown in the figure can be illustrated as follows:
- The vehicle reports its information to the host, including its current position, velocity and other possible information. Here, we assume that the vehicle has already acquired sufficient information about the static environment based on technologies such as SLAM.
- Meanwhile, the host keeps generating FSK signals. It also records the current state information of Horus, i.e., whether the vehicle will collide with an undetected moving object at the corner. We set IDLE to represent that there will be no collision, and ALARM to tell the vehicle to decelerate or stop to avoid collision. This information will be modulated on the amplitude of FSK signals following the way we propose later in this section.
- The host receives the radar detection signal from USRP, followed by subsequent signal processing to get the range and velocity of the possible target.
- The host will analyze a sequence of data to determine whether there is an approaching target in the blind area.
- If yes, then the host will synthesize a sequence of range information of the moving target to build up a model that can predict the future trajectory of the target.
- Meanwhile, the host can estimate the future trajectory of the vehicle from the other side following the information transmitted by it. In the experiment, we instructed the vehicle to maintain uniform motion.
- Based on the analysis of both the vehicle and the target, the host can estimate the probability of a collision at the corner and set the state information correspondingly.
- If the state changes from IDLE to ALARM or vice versa, the host will immediately configure the RIS to direct the beam toward the vehicle. Otherwise, it will periodically broadcast the current system’s state information to the other side of the vehicle by changing the beam direction at a fixed frequency.
The above content provides a brief overview of the system’s workflow. In the below subsections, we will provide more detailed explanations of the key components of the system.
2. Integrated Sensing and Communication with FSK
In the second section, we introduce the FSK modulation that uses different frequencies to represent different bit information. However, the traditional pattern of transmitting each frequency in a way of time division is somehow unavailable for us to measure the range because we need to emit signals with two frequencies simultaneously.
To achieve ISAC without transmitting different signals in different time slots. We choose to simultaneously transmit signals with two frequencies but with different amplitudes. For example, if we want to transmit the bit “1”, we set the amplitude of the signal with frequency $f_{c1}$ as 1 and the signal with frequency $f_{c2}$ as 0.1, while for bit “0” is vice versa. The aggregate signal will be transmitted, the radar receiver will still be able to identify the phase difference to get the location of the object, while the receiver deployed on the vehicle can just follow the basic FSK demodulation scheme to get the information transmitted from Horus.
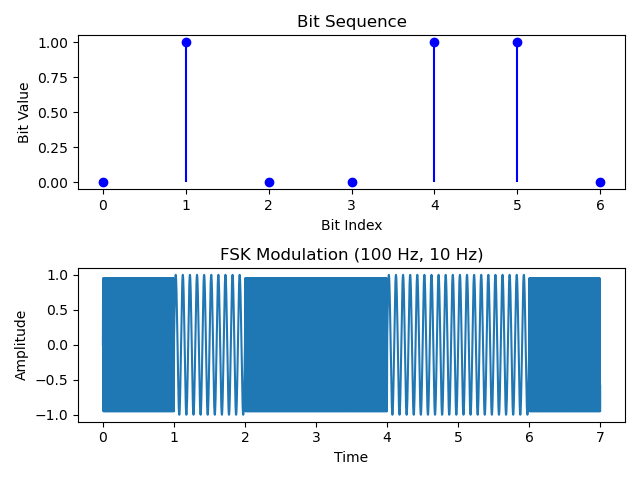
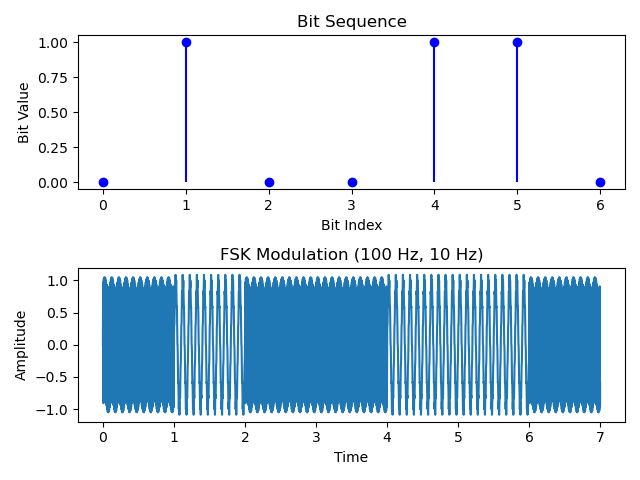
Some may argue that EM waves of different frequencies may experience different paths and corresponding losses when propagating in a medium. Therefore, if information is transmitted based on their amplitudes, it could be severely disrupted. For example, a wave with a relative amplitude of 1 may suffer greater losses, resulting in the amplitude of that frequency in the received signal being even smaller than that of a wave with a relative amplitude of 0.1 in another frequency. It can be explained by coherence bandwidth, which represents the range of frequencies over which the variations in the channel response are relatively small. Typically, the coherence bandwidth increases with the frequency. According to
3. Frame Structure

The above shows the frame structures of radar detection and state information
As for the state information, though we only have two states of IDLE and ALARM, however, using only one bit to encode it is not robust to variation of the environment. To increase the Hamming Distance between two codes, we use the concatenation of the Morse code for the words ‘IDLE’ and ‘ALARM’ as the state information
In our system, these two frames are continuously generated simultaneously. To realize the FSK modulation we propose in the last section, the process is quite simple by using numerical operations on signals from the Gnuradio library. However, to achieve high accuracy in measuring the phase, we need to adopt a very high sampling rate, under which the numerical operations between two signals may be severely affected by timing error
The whole working process of Horus can be partitioned into two phases: The sensing phase and the communication phase. We set a fixed number of sensing packets. In the sensing phase, Horus will transmit and receive that number of packets, subsequently, it will change to the communication phase. The host will configure RIS to direct the beam toward the vehicle for a fixed time interval to transmit the state information. At last, the beam will be re-directed to detect the blind area and start a new sensing phase. Note that in the whole process, if there is no change in the state information, Horus keeps transmitting the same signals.
4. Data synthesis
In this section, we introduce the core data processing part of Horus, about how it detects, tracks the approaching target and determines whether a collision will happen.
(1) Moving Target Detection
Due to its high frequency and short wavelength, millimeter waves are prone to attenuation in the air
To find an appropriate feature to detect, in the experiments, we compare received signals with and without a moving object. The finding is that when there is no object in the detecting range, the velocity we get is close to zero and very stable. However, when a moving target appears within the range, the velocity will start to deviate significantly from zero. Besides, the direction of the velocity deviation from zero (i.e., positive or negative velocity) corresponds to whether the object is approaching or moving away from Horus. Thus, we set two thresholds of $v_{th}$ and $t_{th}$. If Horus gets the velocity above $v_{th}$ in at least $t_{th}$ sensing packets, then it will determine that it has detected a target approaching the intersection and start to collect the range information to infer the future trajectory of the target.
(2) Trajectory Estimation
For directional antennas, if the side lobe level (SLL) is high, the problem of a false target or alarm may occur, which may induce abnormal data points of range or velocity
With a particle filter, we can predict the position of the target at the next sample time. However, this is based on the assumption that the target can be approximated as moving at a constant velocity. If we want to predict the target’s motion trajectory for a longer period in the future, this assumption no longer holds. Thus, one may try to use a longer sequence of data points to do the prediction. Yet one of the problems is how long this sequence should be. If the sequence length is too long, the model may excessively smooth some sudden behaviors, such as abrupt stops and starts, leading to larger errors in predictions. If it is too short, it may also lead to inaccurate predictions due to the limited number of samples.
Therefore, we aim to build a model that can leverage the data from long sequences while assigning higher weights to data points that are temporally closer to the current time point. A natural idea is to use a Long Short-Term Memory (LSTM) network, based on recurrent neural networks, which can continually balance the relative weights of long-term and short-term memory through forget gates and input gates. However, the neural network in LSTM contains a large number of parameters, and the computational resources and time required for training and prediction pose a significant challenge for lightweight hosts to respond quickly.
Nevertheless, we can still manage to adopt the idea of LSTM in a much simpler model. In our system, we propose a method of dynamic weighted support vector regression (DWSVR), which can be elaborated as follows:
- We maintain a First-In-First-Out (FIFO) sequence of length L at each time slot t
Here, t should satisfy $t\geq L$. , expressed by \(Q_t=\{(x_{t-L+1}, v_{t-L+1}), \cdots, (x_t, v_t)\}\). Here $x$ and $v$ are outputs of the particle filter. - Use the FIFO and weight vector \(\boldsymbol{w}_t\) to train a support vector regression (SVR) model. At the beginning, the weight vector is initialized as a sequence of all ones.
- Use the model to predict the trajectory \(\hat{Q}_t= \{\hat{x}_{t+1}, \cdots, \hat{x}_{t+\hat{L}}\}\) in the following $\hat{L}$ time slots.
- At time slot t+1, the FIFO becomes \(Q_t=\{(x_{t-L}, v_{t-L}), \cdots, (x_{t+1}, v_{t+1})\}\). Calculate the posterior probability of the true position of the target at time t+1 relative to the predicted position using a Gaussian model, i.e., $p(x_{t+1}||\hat{x}_{t+1})$.
- For \(w_{i,t+1} \in \boldsymbol{w}_{t+1}, t-L\leq i<t+1\), it first follows a decay function of \(w_{i,t+1}=\min\{\eta w_{i+1,t}, 1\}\), where $\eta$ is the decay coefficient. Then for $w_{t+1,t+1}$, it is replaced by \(\frac{1}{p(x_{t+1}\|\hat{x}_{t+1})}\). At last, the weights are regularized by \(w_{i,t+1}=\frac{w_{i,t+1}}{\sum^L_{j=1}{w_{j,t+1}}}\)
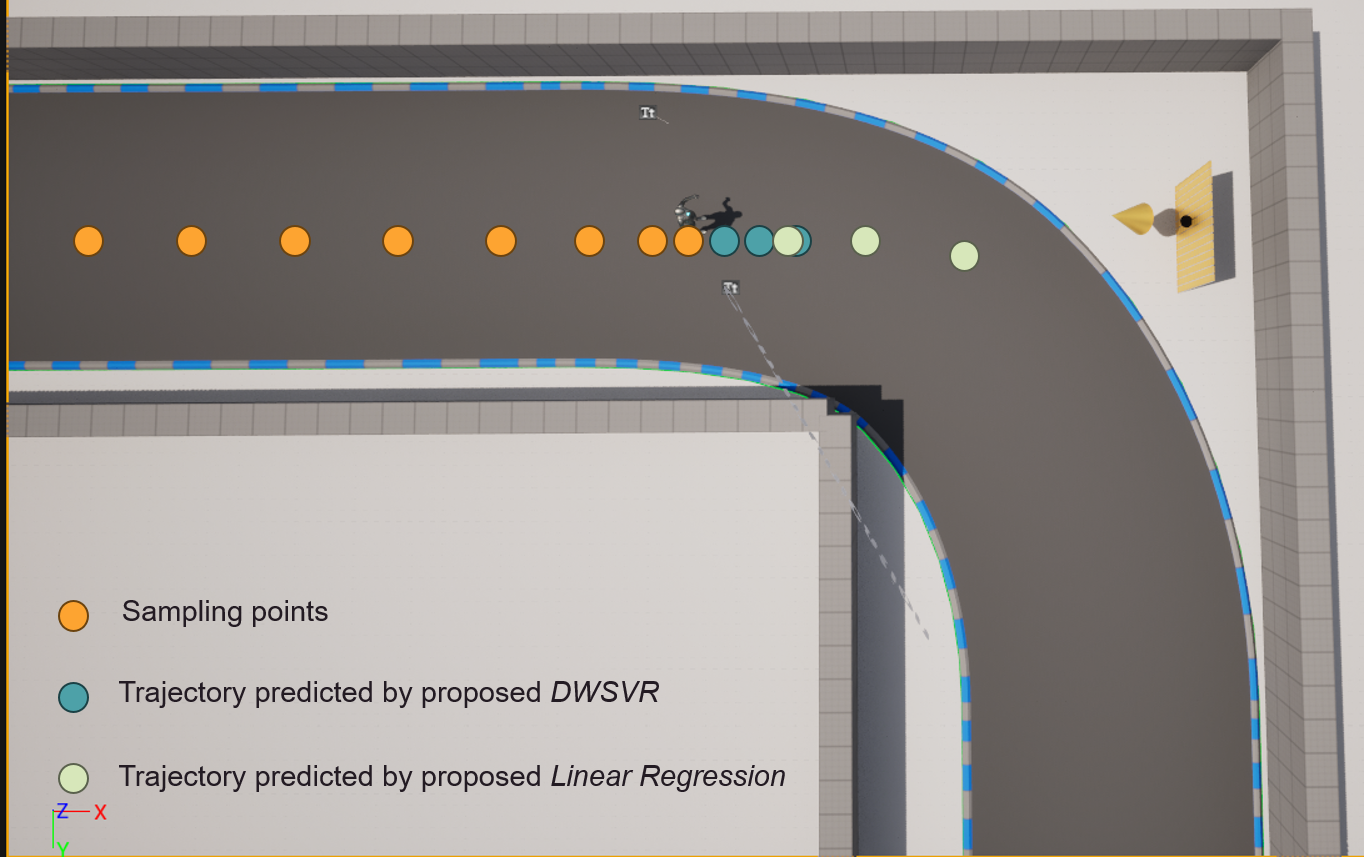
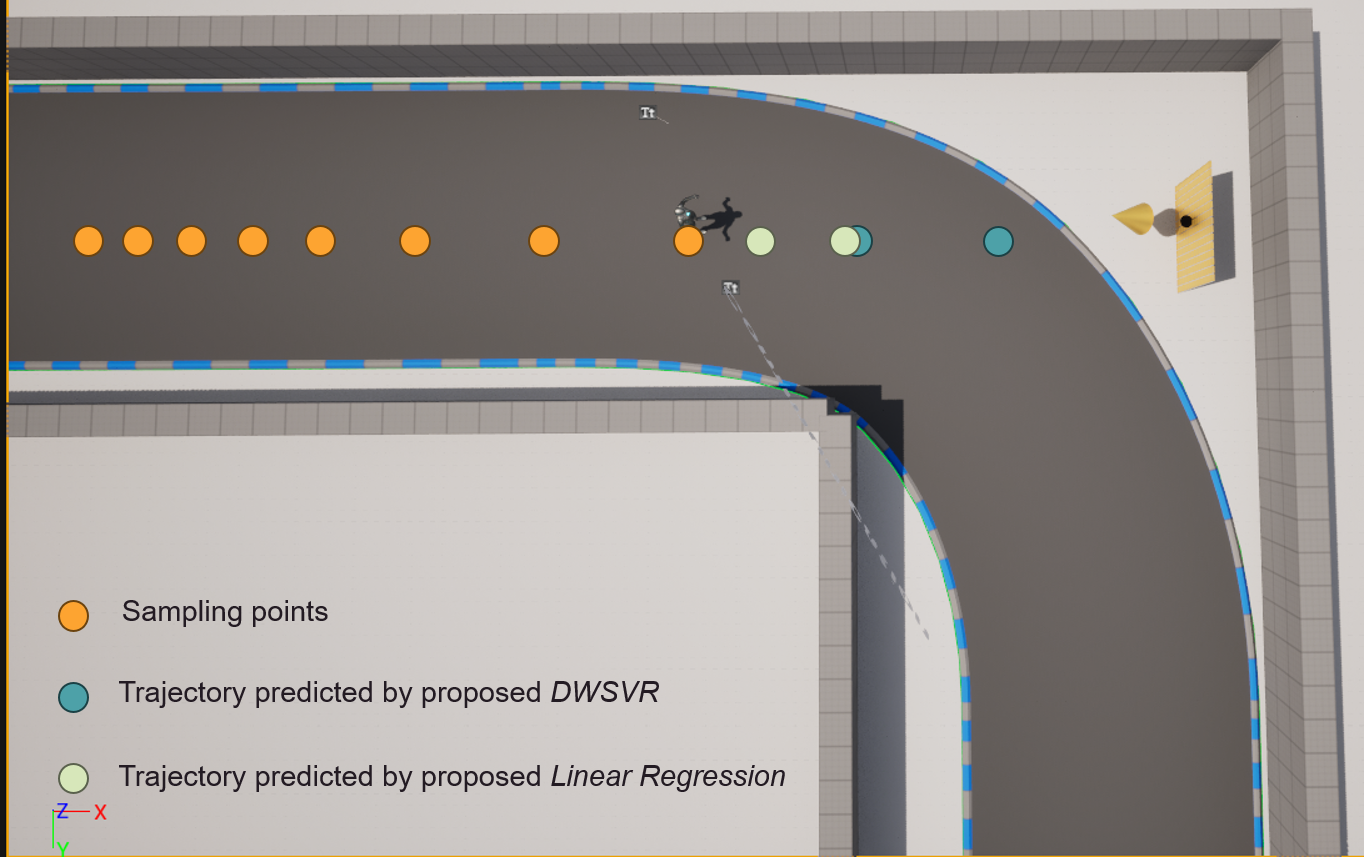
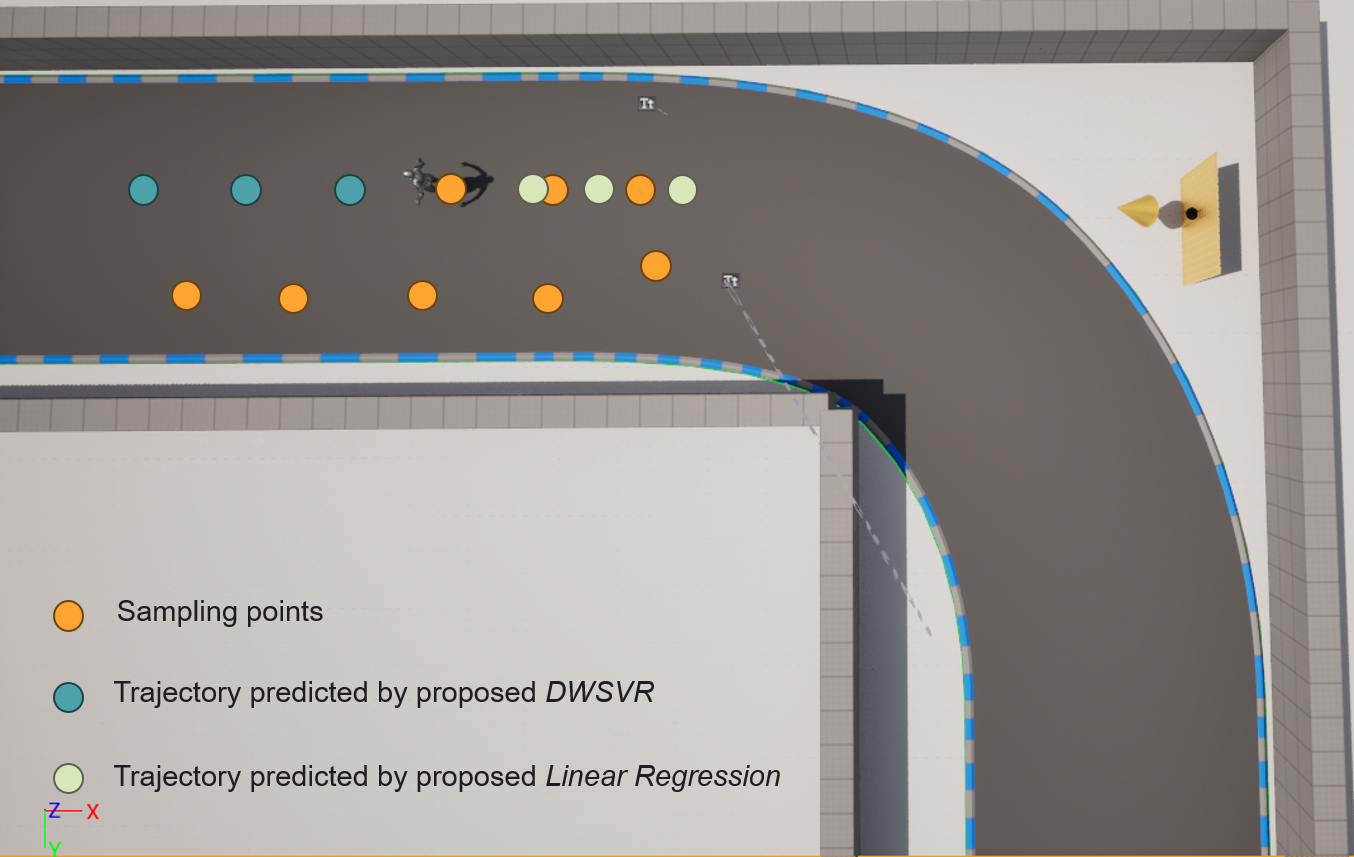
As shown above, the basic idea of DMSVR is weigh all the sampling points depending on the likelihood of the predicted and real positions of the target. If the likelihood is low, it means the performance of the prediction model is degraded. Therefore, we need to assign higher weights to those sampling points that are temporally closer to the current time. This method balances the model’s complexity and predictive performance. The figures below compare the predicted trajectory of the proposed DWSVR and linear regression under three different scenarios.
(3) Collision Determination
As each sensing packet has almost the same duration, once we have estimated the future trajectory of the target in the next few sampling points, we can infer its position at several discrete time points. For example, in our test, the duration of each sensing packet is 0.15s, if we predict its trajectory in the next three sampling points, then we can know its positions after 0.15s, 0.3s, and 0.45s. Based on that, we need to find the “Anchors of the trajectory”, which should satisfy the following requirements:
- The two anchors must be adjacent in the predicted position sequence.
- The reference point of the intersection must be located between the two anchors.
- If it is impossible to simultaneously find two anchors that satisfy the above two requirements, it is assumed under the current prediction sequence that no collision will occur.
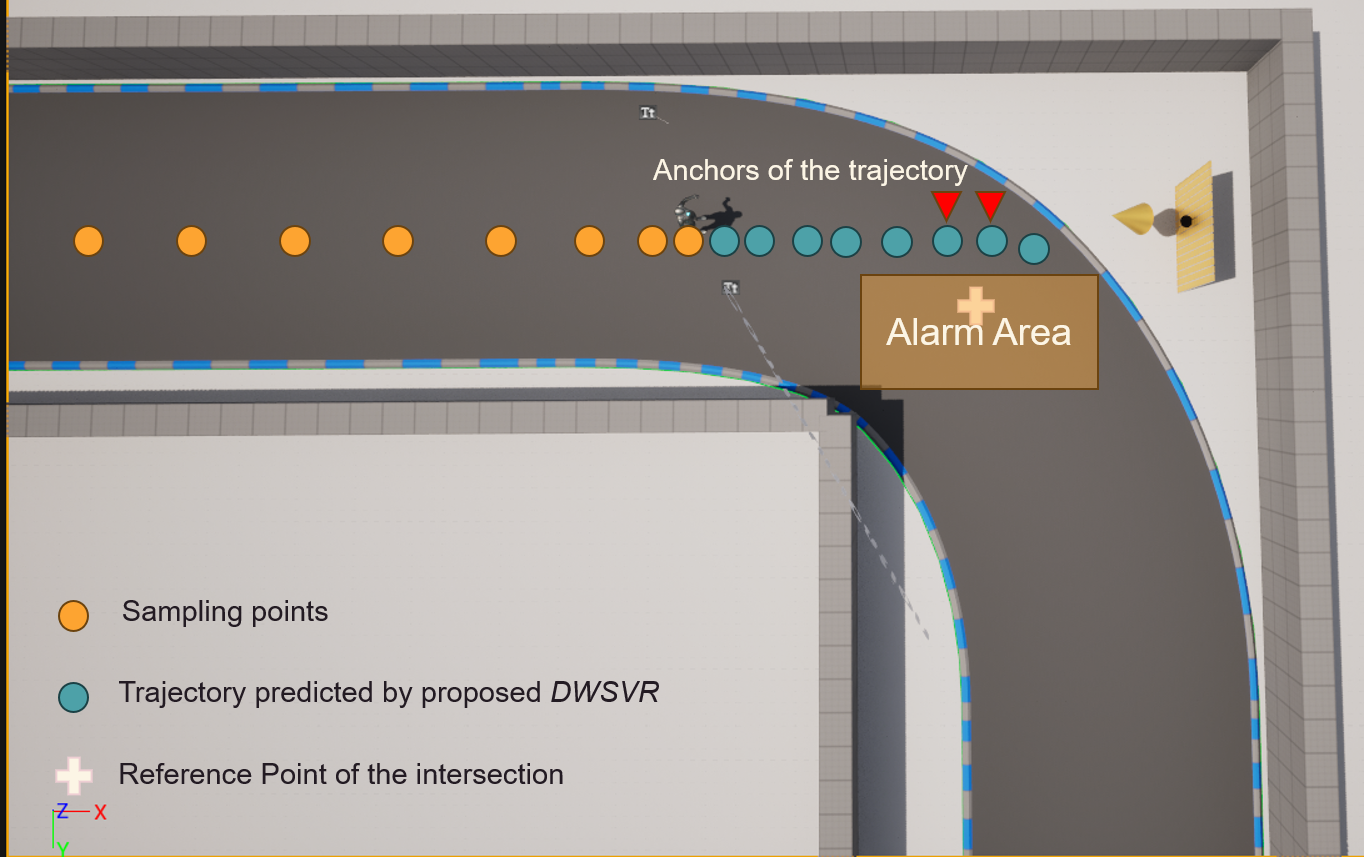
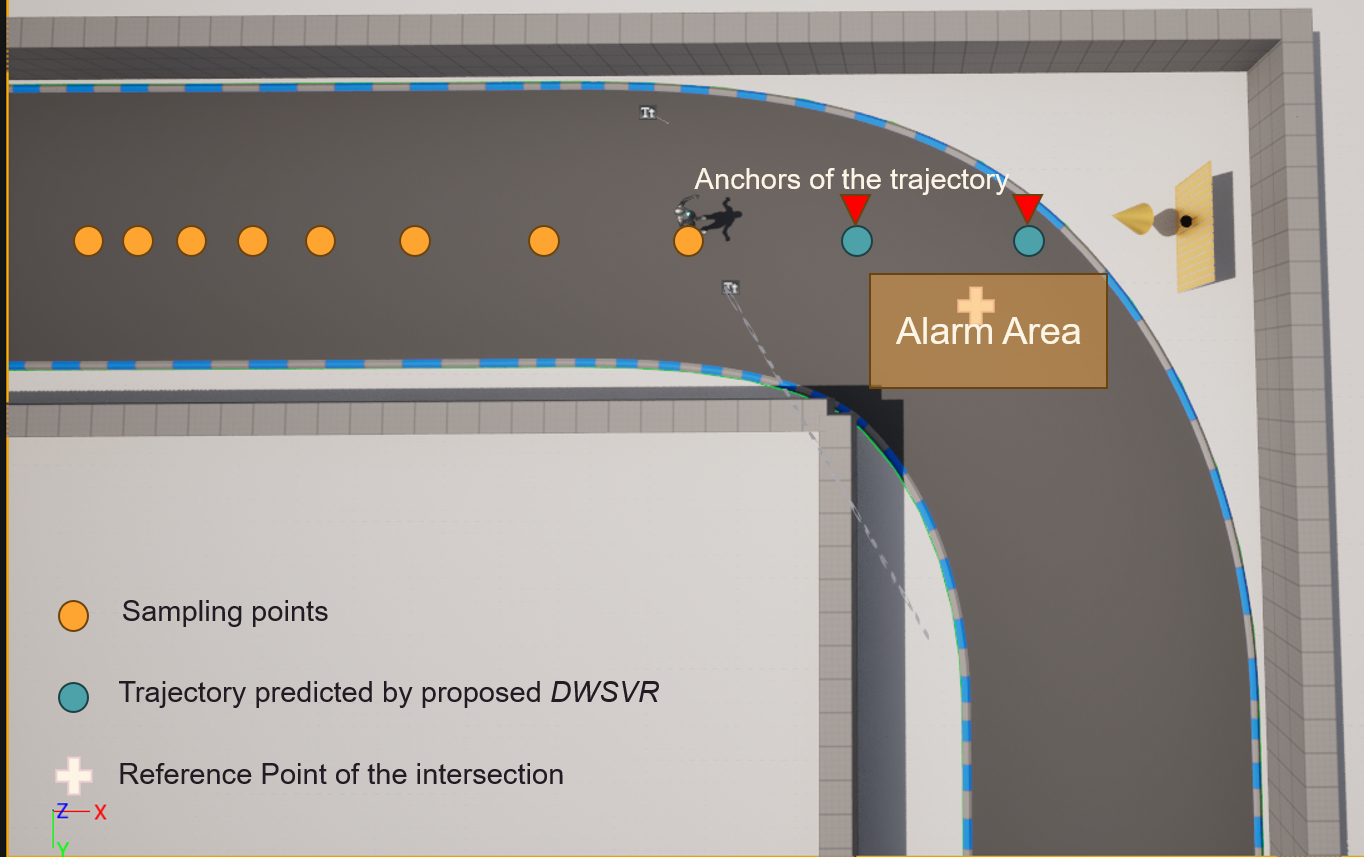
With the two anchors, we can get two time points of when the target will pass the intersection. As stated before, the vehicle will keep reporting its position and velocity. In our experiments, we set the vehicle to move with a constant velocity. Thus, the host can estimate the positions of the vehicle at those two time points, which form an “Alarm Area” as shown in the above figures. Once the host knows that the intersection reference point is included in this area, it determines that a collision will occur and immediately changes the state information to ALARM, meanwhile configuring RIS to direct the beam towards the vehicle. Afterward, the vehicle will choose to decelerate or stop directly to avoid the collision.
Once the target crosses the intersection, Horus cannot detect the target in the detection area. After a period of time during which no objects can be detected, it will restore the state information to IDLE and transmit it to the vehicle in the next communication phase.
V. Implementation
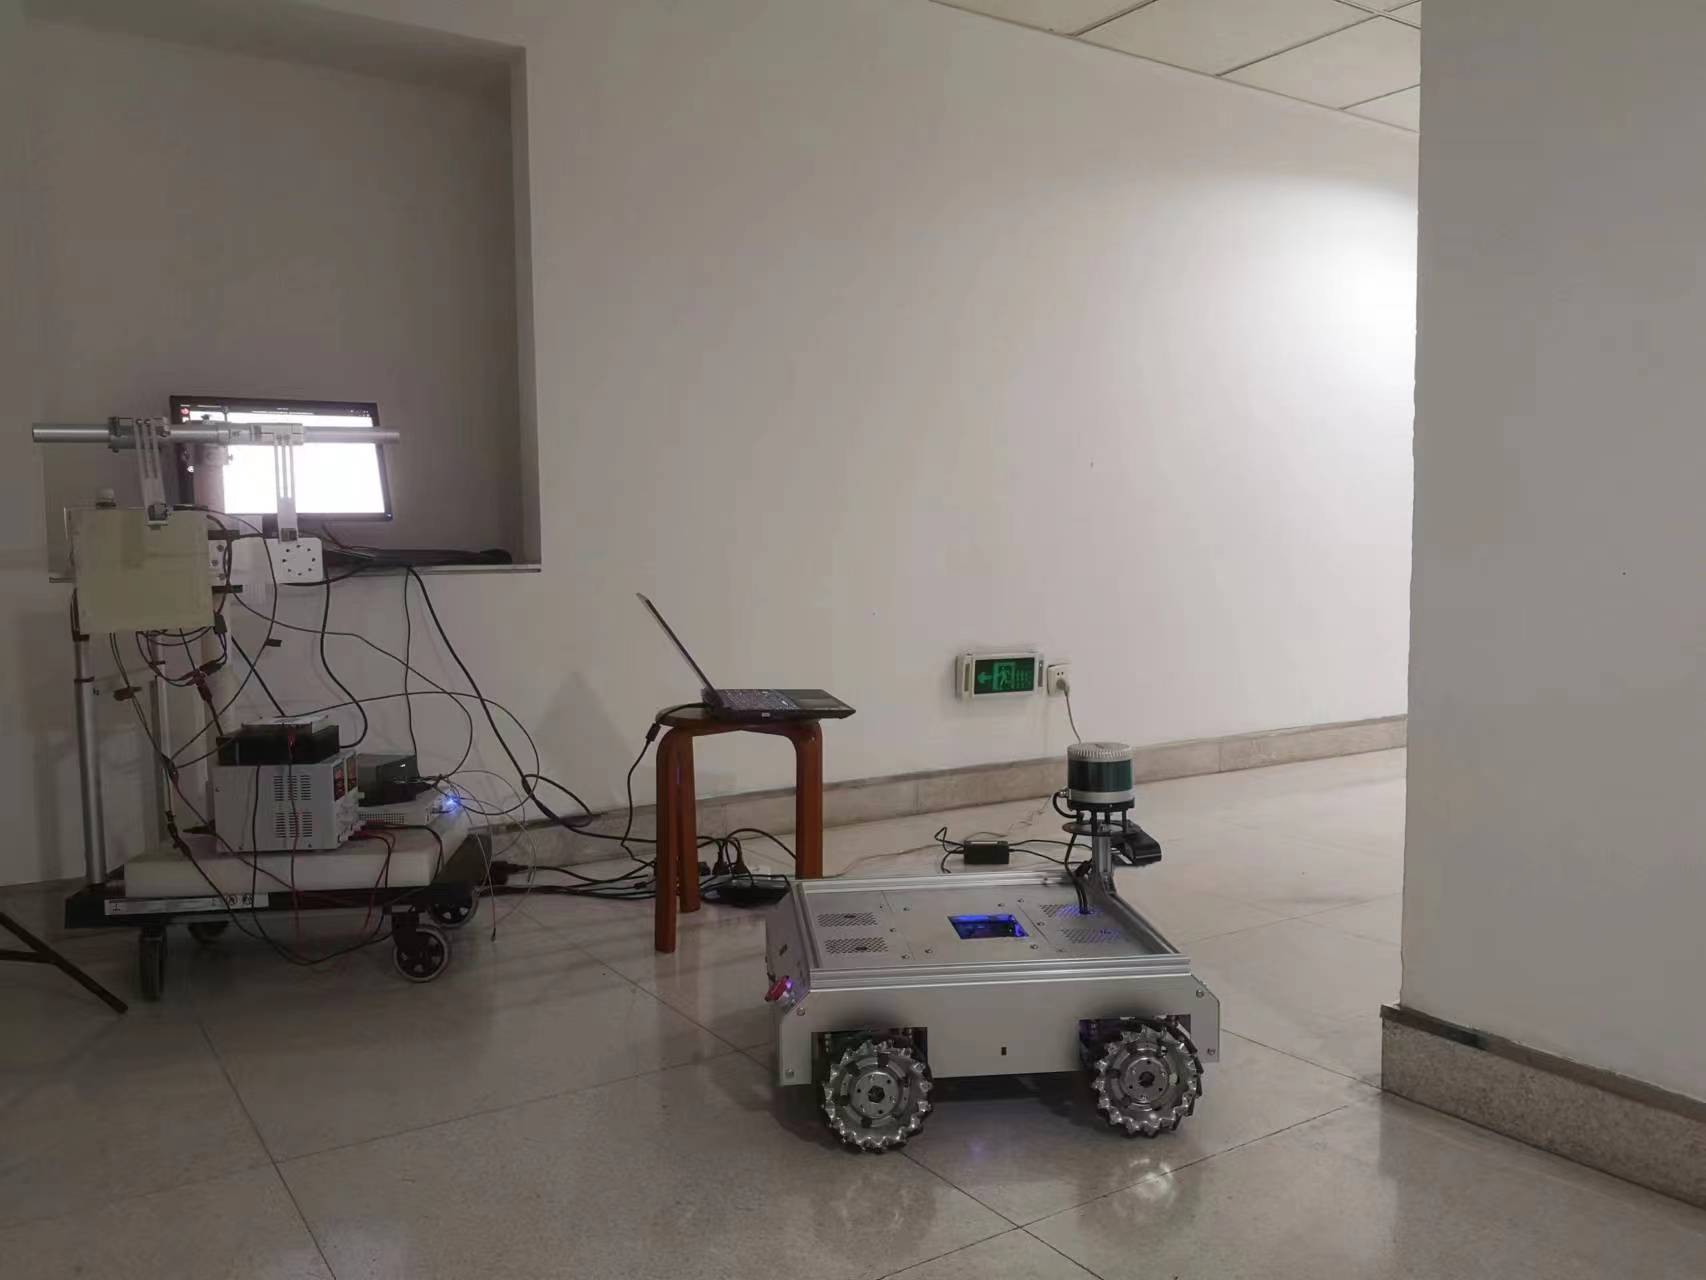
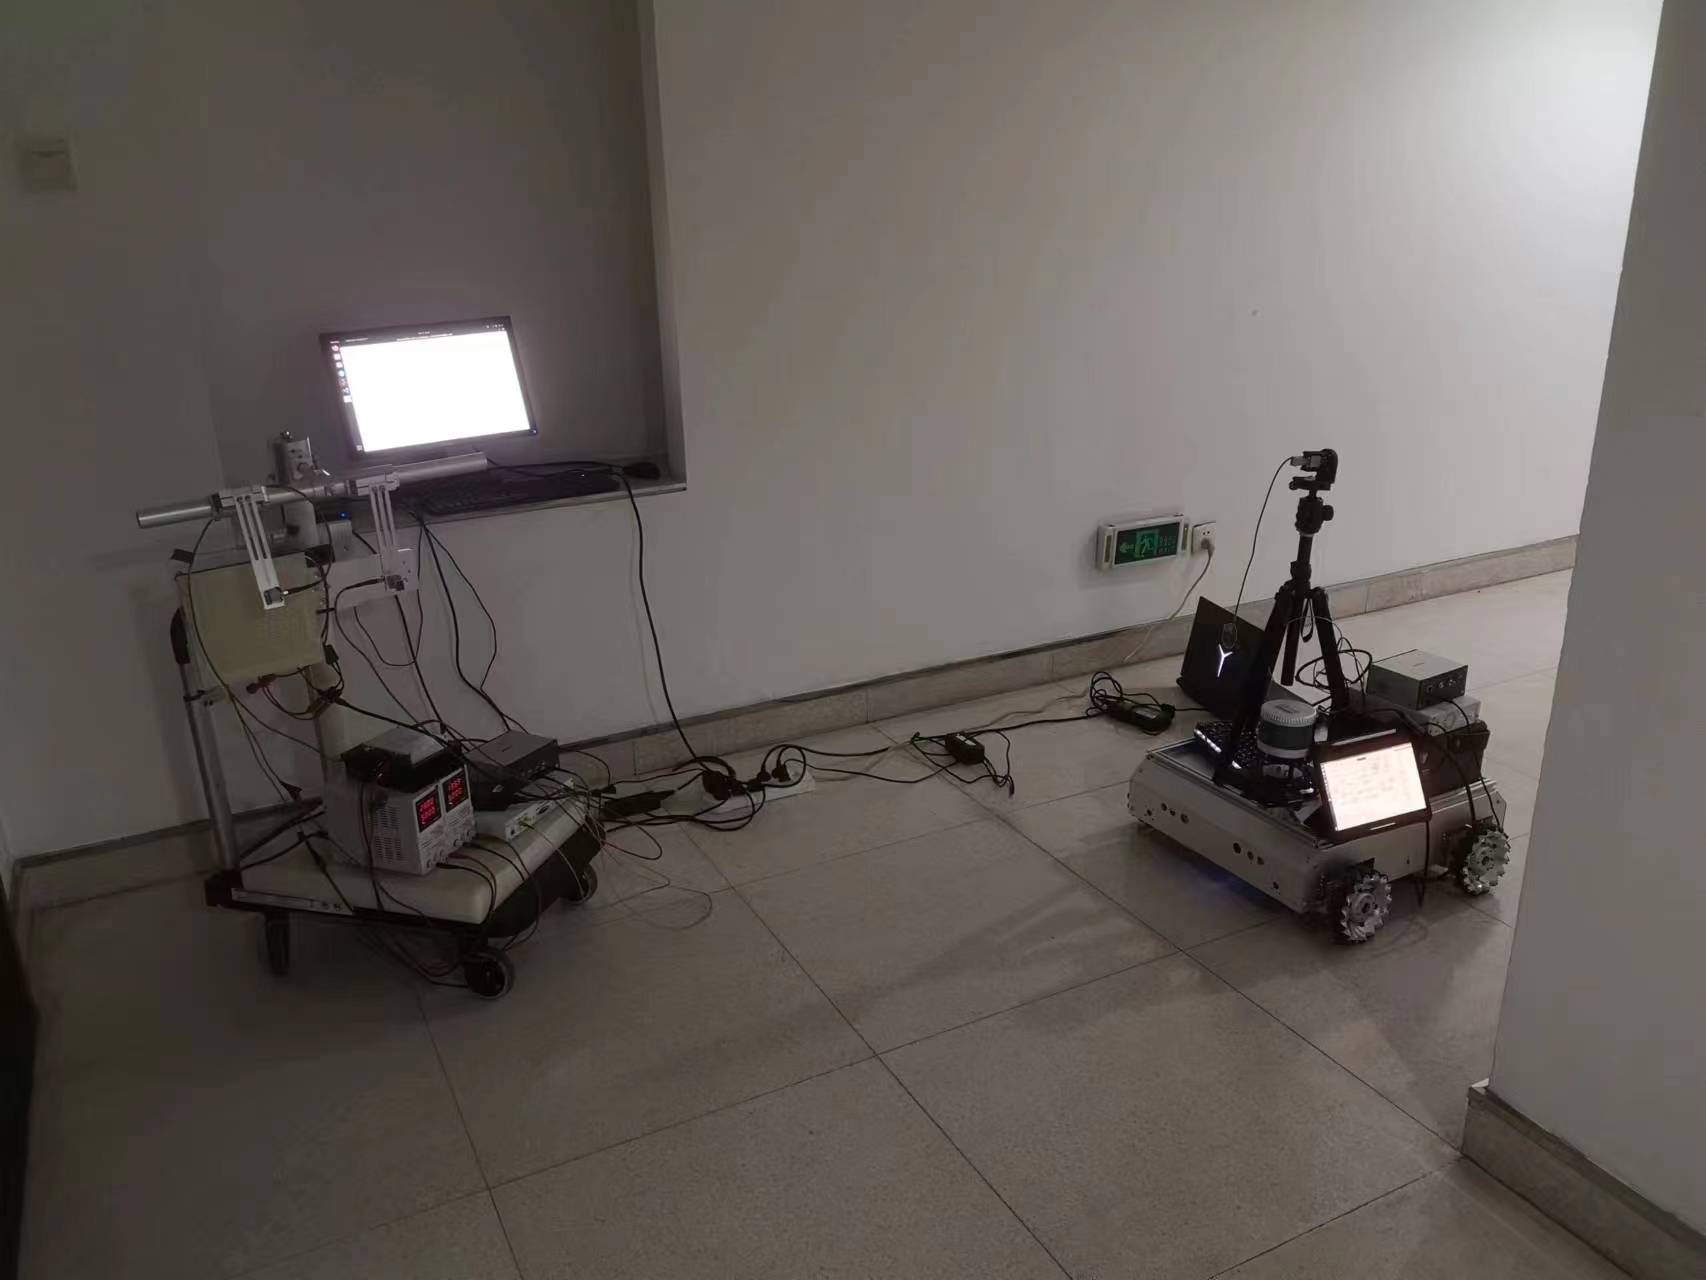
In this section, we illustrate the implementation of the whole system and its working scenario. The setups of Horus and the vehicle are shown in the following two subsections respectively.
1. Horus
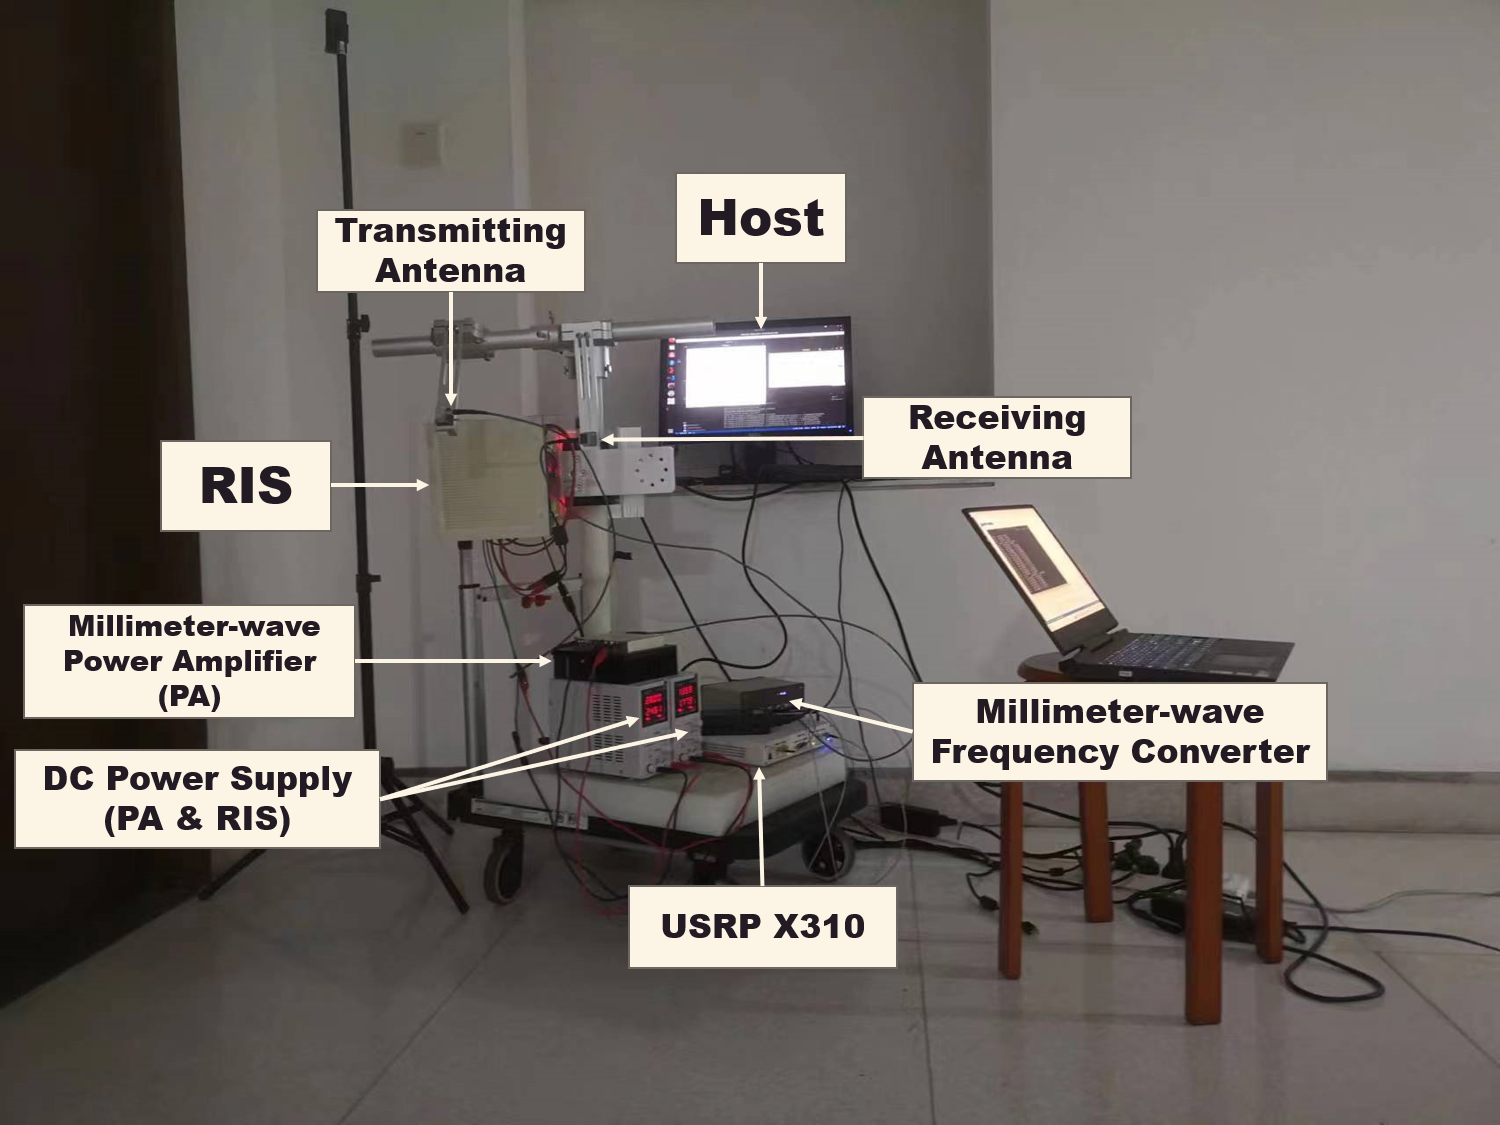
The above figure shows the setup of Horus. The host connects to RIS and USRP via USB and ethernet cable respectively. The USRP model we have chosen is USRP X310, which has two daughterboards and independent channels, allowing simultaneous transmission and reception of signals under the same clock. We set the center frequency of USRP to 2 GHz and the baseband signals generated by the host will be modulated in it. The TX port of one daughterboard and the RX port of the other are connected to two intermediate frequency (IF) ports of the mmWave frequency converter via two low-frequency cables. The frequency converter is produced by TMYTEK and it is used to up-convert the IF signal from USRP to the 26GHz frequency band and down-convert the received high-frequency signal to the IF range. The TX RF port of the frequency converter is connected to the transmitting horn antenna (feed source) through a mmWave power amplifier (PA), where the signal-to-noise ratio of the RF signal is significantly improved. The RX RF port of the frequency converter is connected to another horn antenna receiving the radar echo signals.
Note that both RIS and PA require DC power, thus, we use two DC power supplies with output voltages of 28V and 13.59V respectively to power these two devices. The other devices in Horus are all powered by the standard Chinese mains electricity, which is 220V AC.
2. Vehicle
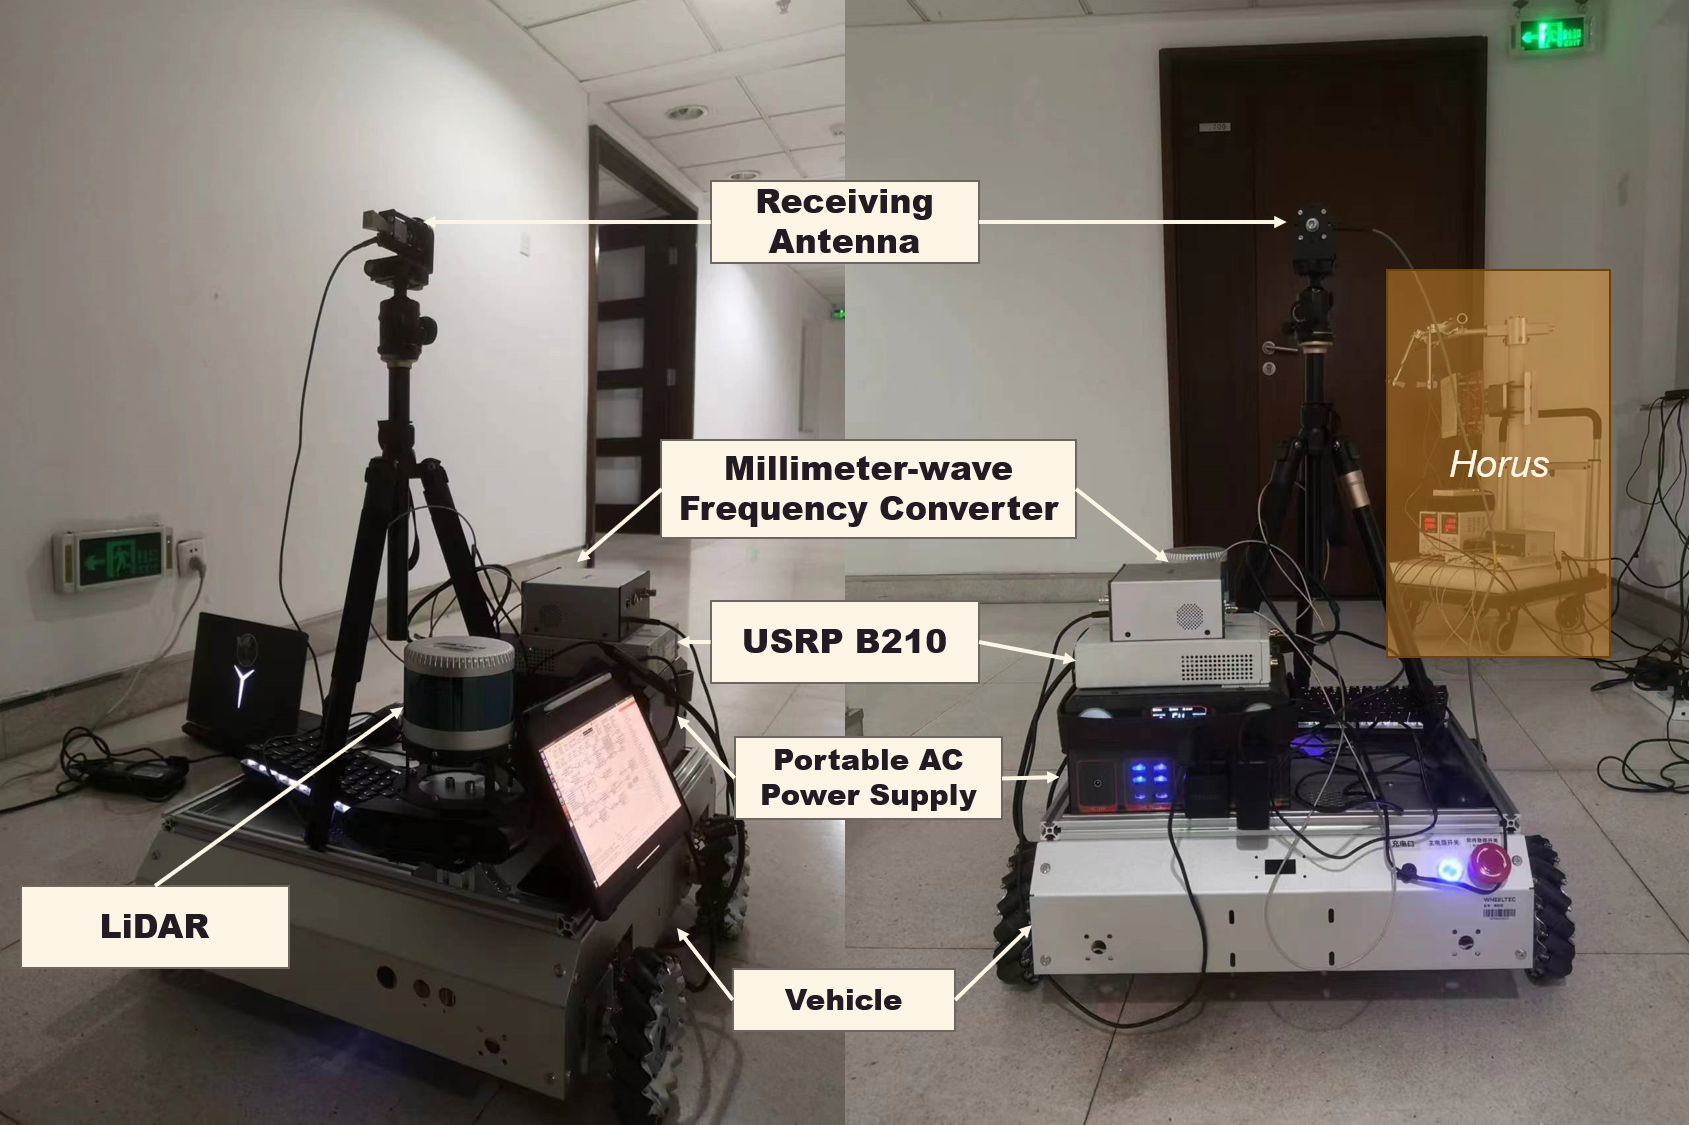
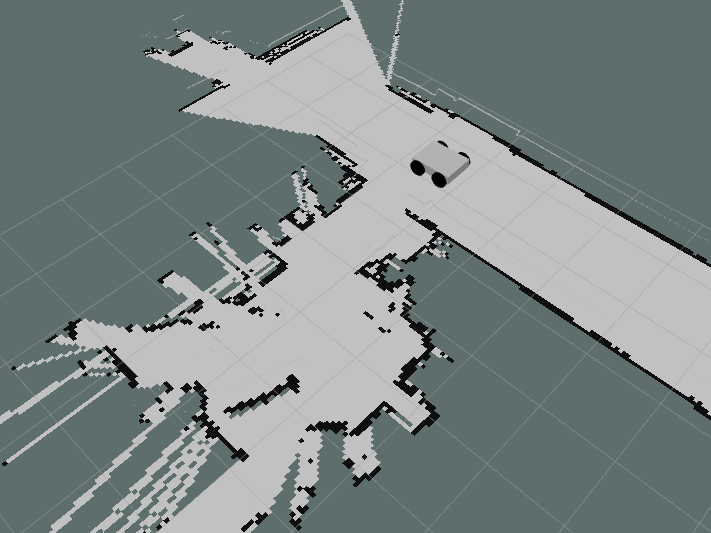
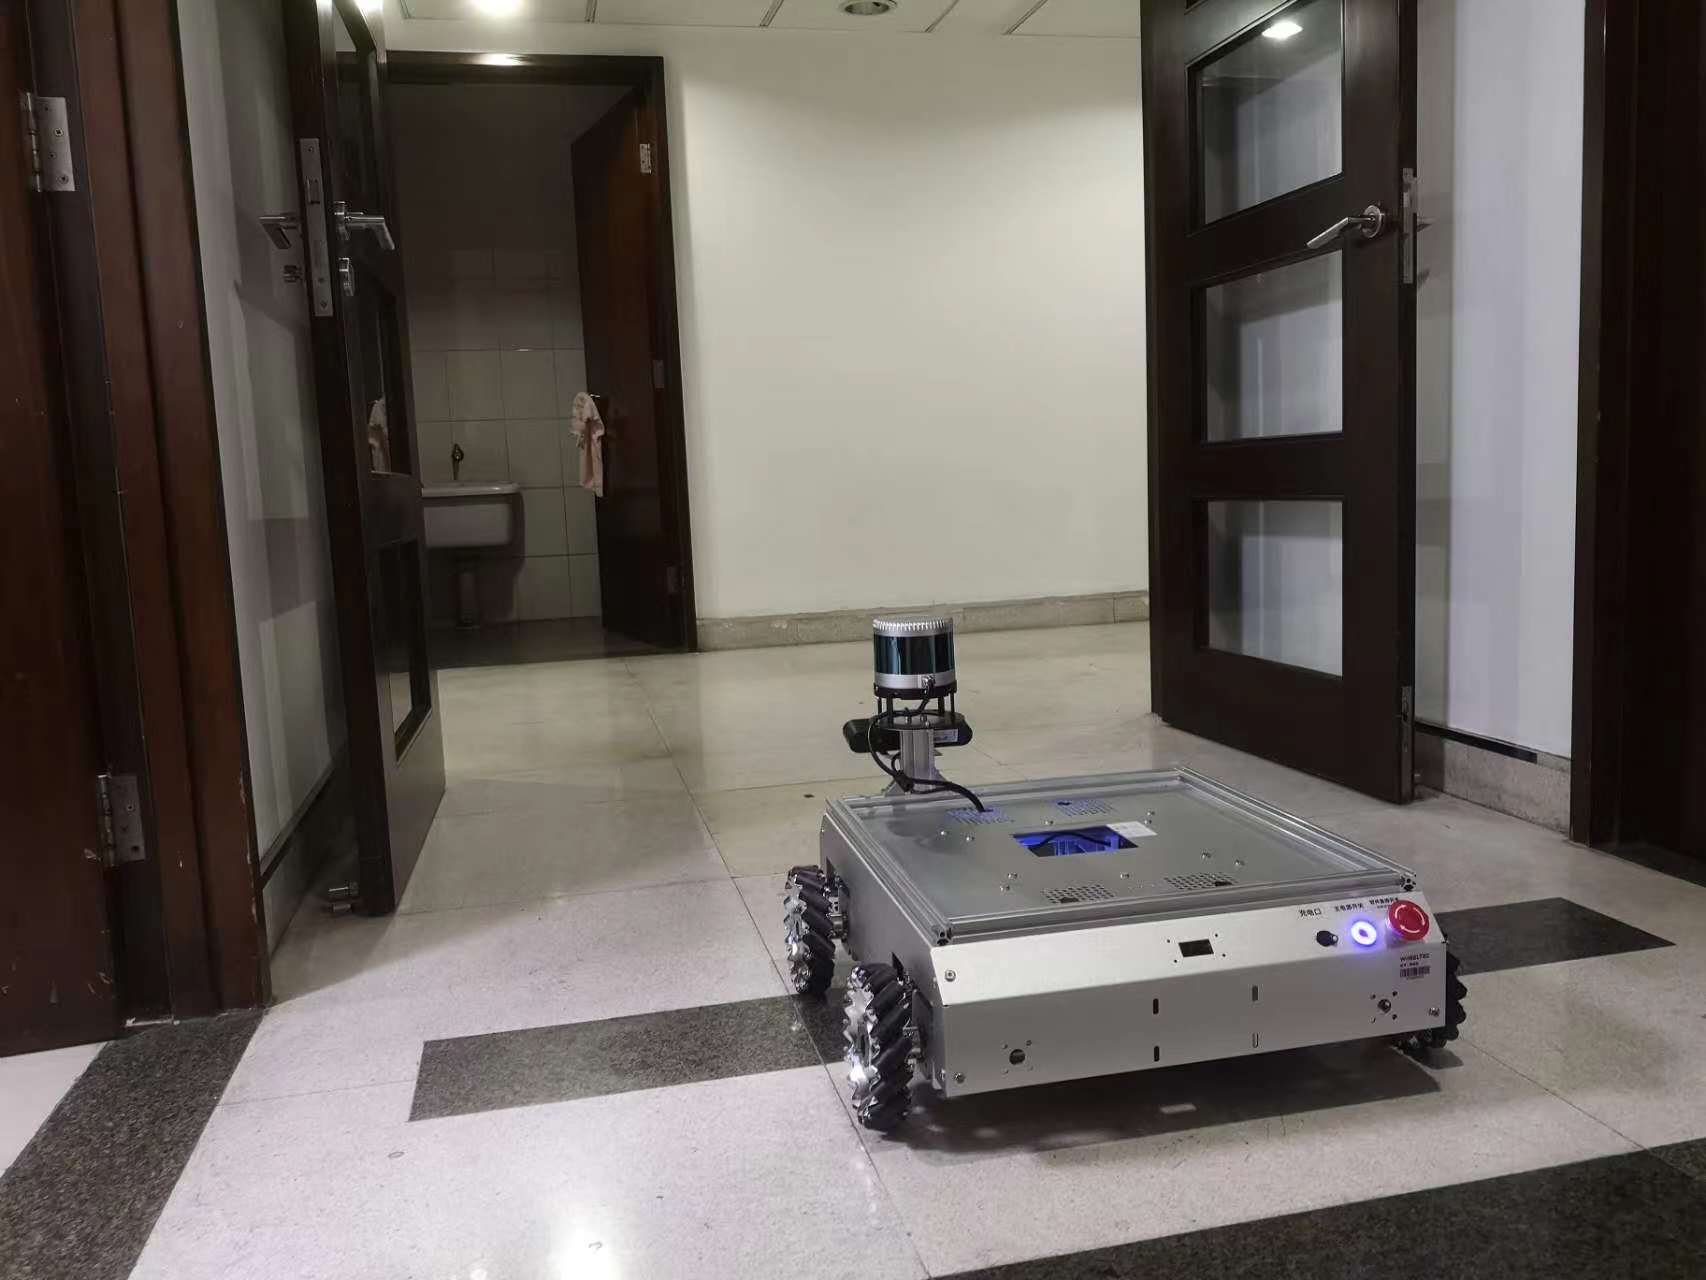
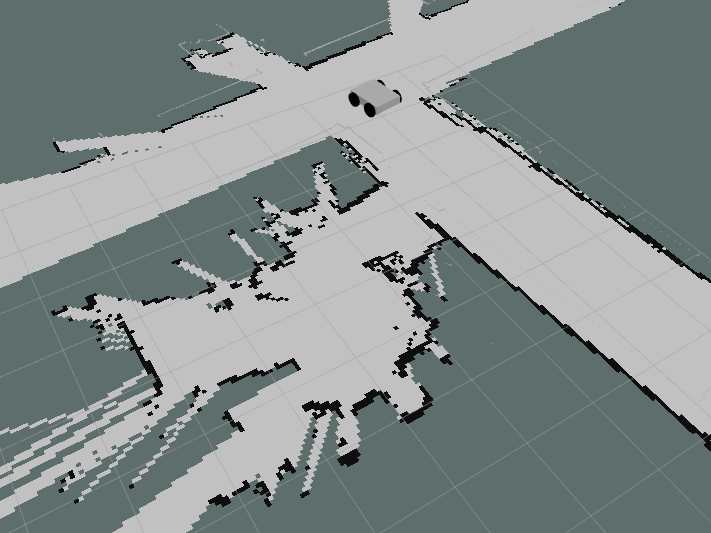
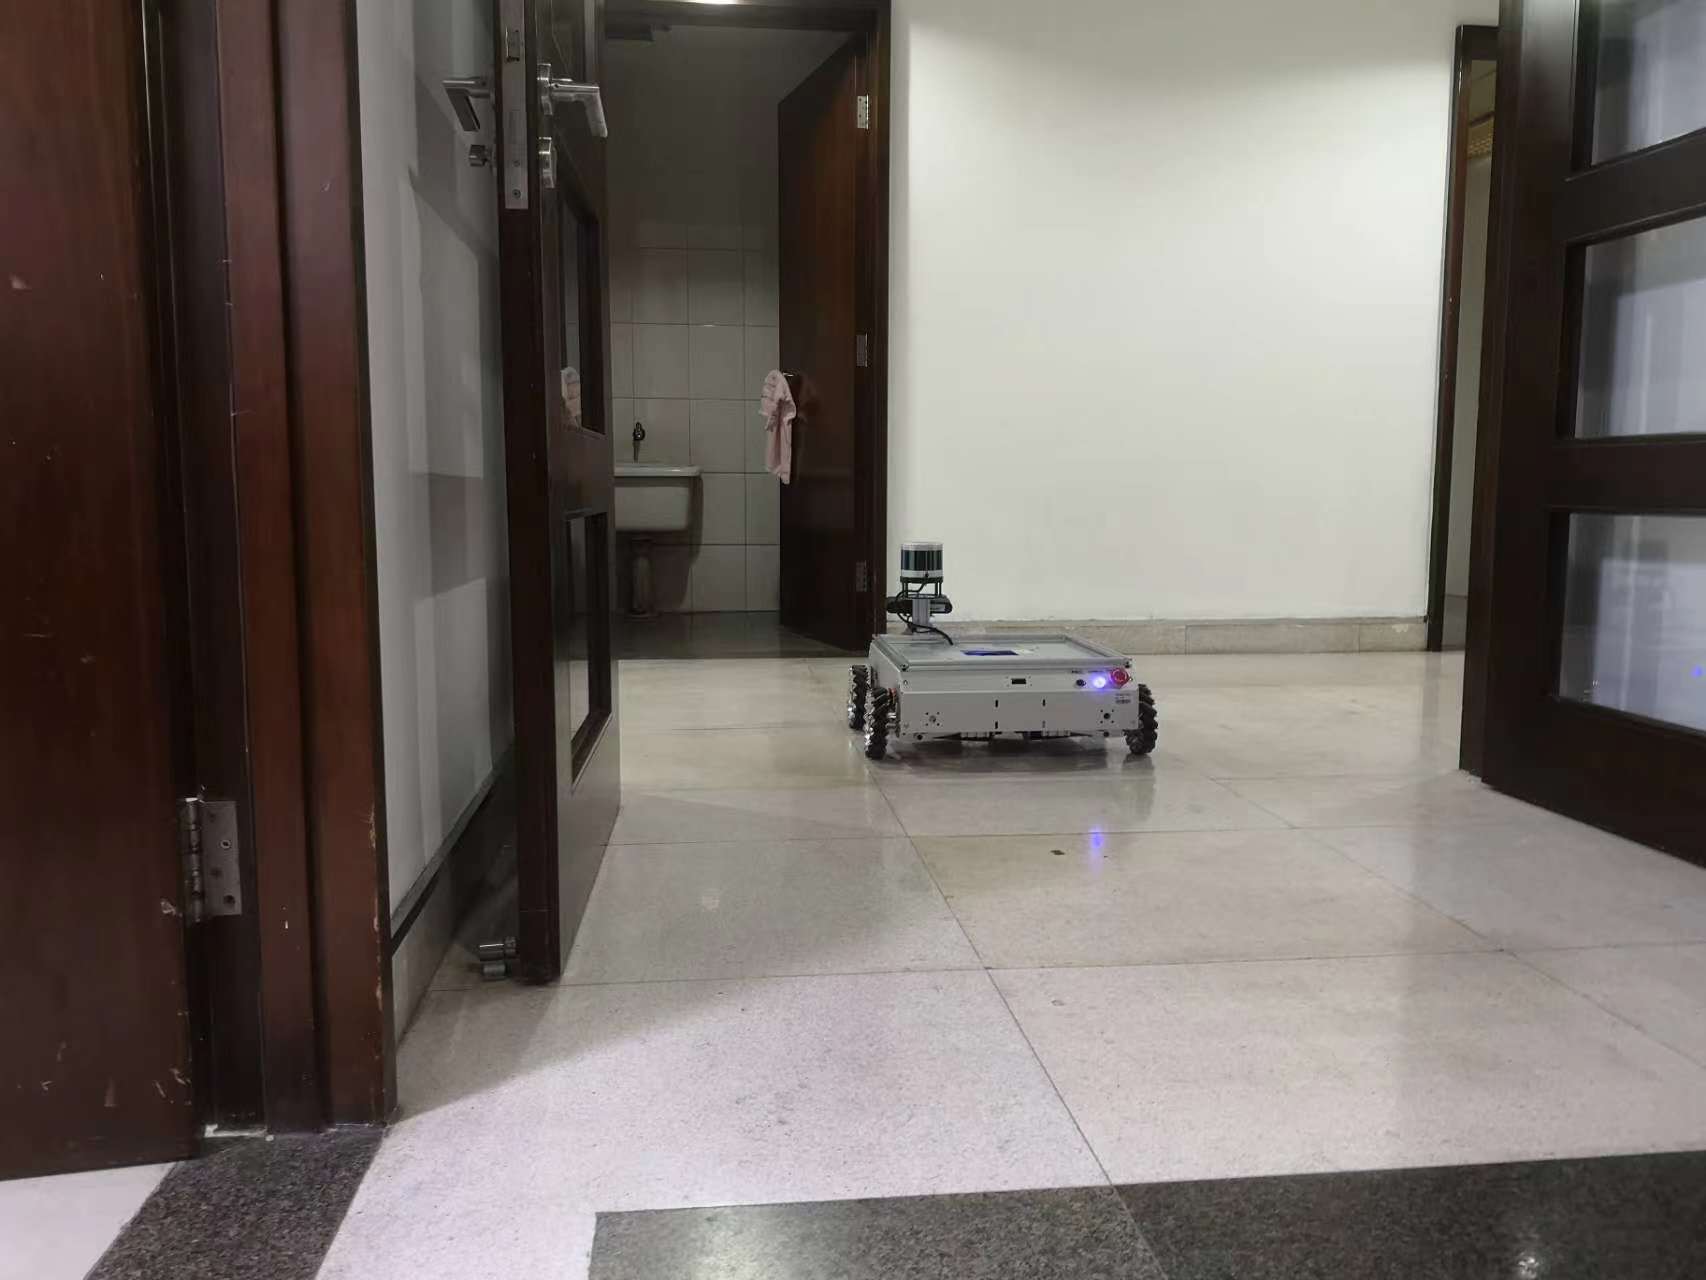
The above figure shows the setup of the vehicle. For the body part, we directly use the product by WHEELTEC
VI. Experiments
1. Transmission at the transport layer
We first tested the compatibility of Horus with commercial network devices, during which the system status information was transmitted at the transport layer. Horus’s wireless network card is capable of generating a WiFi hotspot. The master computer mounted on the vehicle can directly connect to this hotspot via WiFi, placing them in the same local area network. Afterward, Horus can establish a socket at the transport layer using the TCP/IP protocol to directly transmit information to the vehicle. The videos below display its working process in this setting.
2. Transmission at the physical layer
Finally, we tested the process where Horus detects the target and directly transmits information to the vehicle using the designed FSK signal at the physical layer. In the following video, due to the presence of multiple devices on the vehicle and the lack of secure mounting, we have set the vehicle speed relatively low for stability.
VII. Conclusion
In this project, we propose an integrated sensing and communication system based on RIS, which can detect and track moving objects in a wide range of blind areas meanwhile transmitting information to the vehicle to avoid possible collision. The presented content above is a coarse demo, and there are many incomplete aspects in terms of functionality and design. We will keep on improving Horus and please stay tuned for further updates!